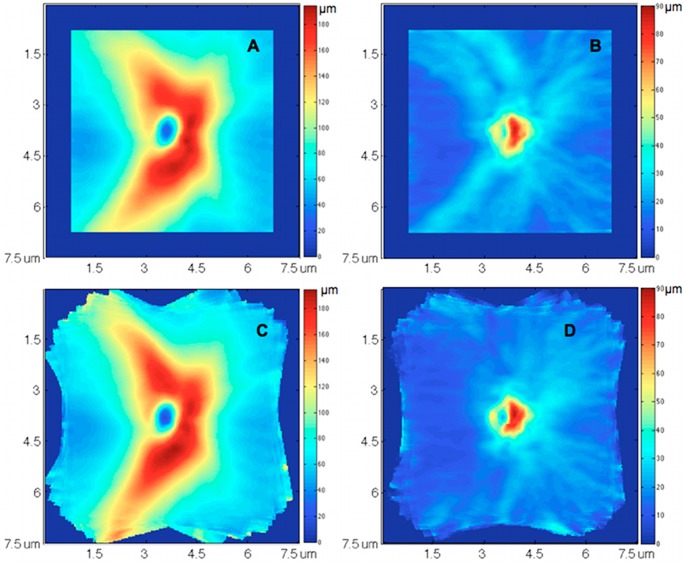
Figure 2. Normative database normalization with 46 healthy eyes.
(A, B) mean and standard deviation (SD) of retinal nerve fiber layer (RNFL) thickness measurement at each sampling point (A-scan), without normalization. (C, D) mean and SD of RNFL thickness measurement after normalizing individual’s retinal nerve fiber bundle path location to population’s average location. The variations of RNFL thickness were larger at superior temporal and inferior temporal regions (brighter blue in B) because of the population variation of the bundle locations. After aligning the bundle locations and normalizing the RNFL thickness map, the RNFL thickness variations at these two regions were markedly reduced (dark blue in D).

