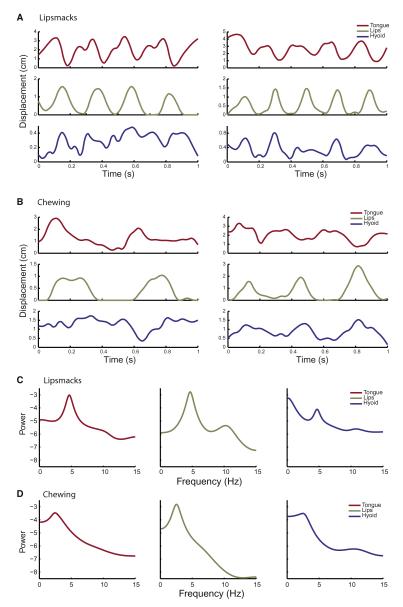
Figure 3.
Rhythmic Structure of Orofacial Movements
Time-displacement plot of the tongue, interlip distance, and hyoid for two examples of lip-smacking from two different monkeys (A) and chewing from two different monkeys (B). The x axis depicts the time in s and the y axis the displacement in cm. Power spectra of the time-varying displacement of the tongue, interlip distance, and hyoid during lip-smacking (C) and chewing (D) are shown. x axis depicts the frequency in hertz, and the y axis depicts the value of the logarithm of power spectrum in normalized units. The upper plots show the power spectrum of the displacement of tongue (red), interlip distance (green), and hyoid (blue). The lower plots show the power spectrum of the same structures during the chewing.

