
Figure 5.
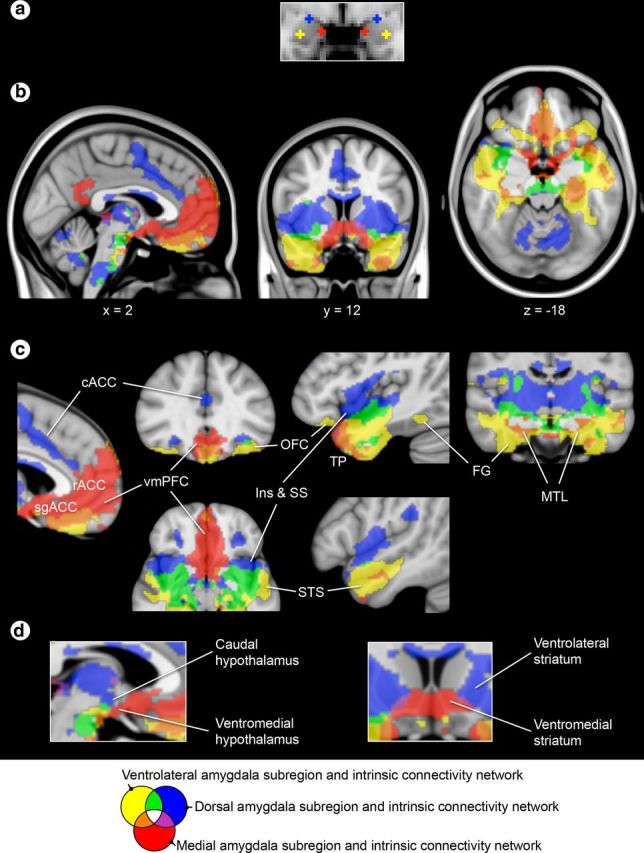
Each amygdala subregion anchors one of three distinct large-scale corticolimbic networks. a, Seeds are localized within the connectionally defined amygdala subregions shown in Figure 2. b–d, One sample group mean statistical significance map for each amygdala seed is displayed in standard views (b) as well as views highlighting specific cortical (c) and subcortical brain regions in the discovery sample (N = 89) (d). The maps are binarized at p < 10−5 and overlaid on a T1 MNI152 0.5 mm template brain in radiologic convention to demonstrate the distinct and shared connectivity across maps. A color key is displayed at the bottom of the figure. cACC, caudal anterior cingulate cortex; Ins, insula; SS, somatosensory operculum; TP, temporal pole; FG, fusiform gyrus; MTL, medial temporal lobe.