
Figure 1.
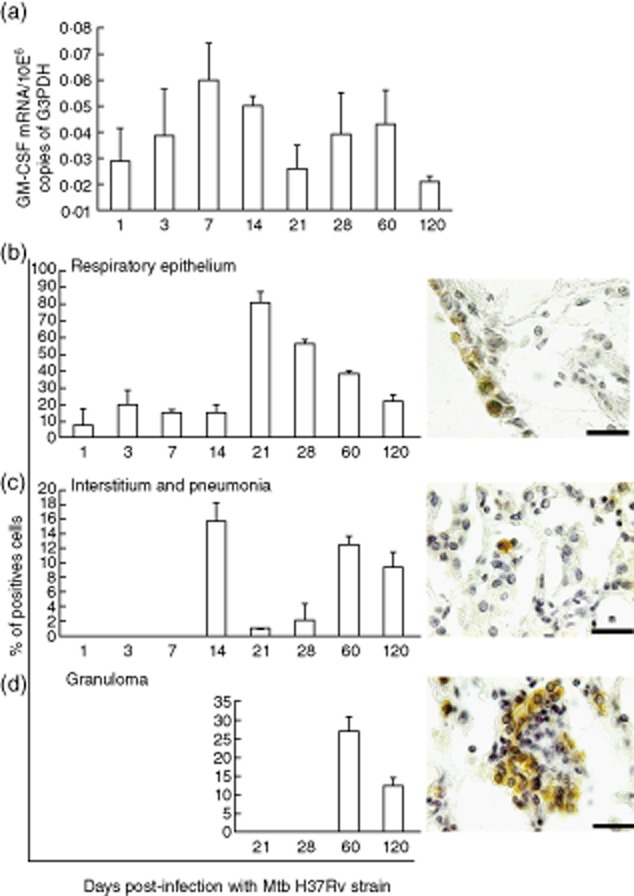
Kinetics of granulocyte–macrophage colony-stimulating factor (GM-CSF) during progressive pulmonary tuberculosis (TB). (a) Five lungs from the same number of Mycobacterium tuberculosis (Mtb)-infected mice at each indicated time-point were used to isolate total RNA and determine the gene expression of GM-CSF by quantitative reverse transcription–polymerase chain reaction (RT–PCR). (b–d) GM-CSF protein expression was detected by immunohistochemistry and the percentage of positive cells was determined in the indicated lung compartments by automated morphometry; representative histological figures of each compartment are to the right of the morphometry graphs (scale bar represents 20 μm). All values are means ± standard deviation (s.d.) from two independent experiments with five mice per group (408 × 552 mm; 150 × 150 DPI).