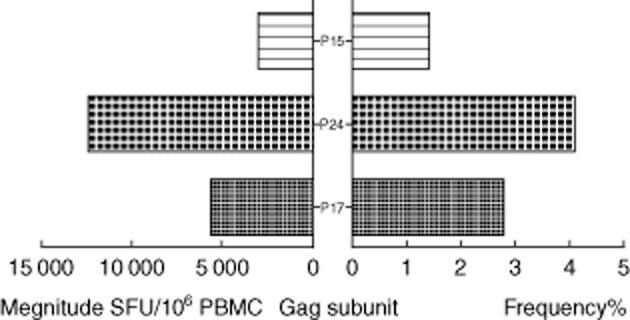
Figure 3.

Total magnitude and average frequencies of the human immunodeficiency virus (HIV)-1B Gag subunit proteins (P17,P24,P15). The left histogram shows total magnitude per protein. The right histogram was average frequency per peptide per protein.
