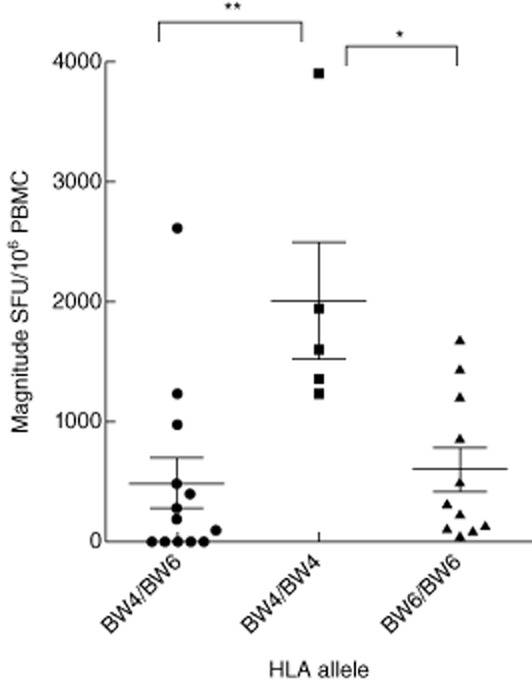
Figure 7.

Relative magnitudes of human immunodeficiency virus (HIV) T cell responses to haemagglutination inhibition assay (HIA). The magnitude of T cell responses to Bw4 and Bw6 is shown. The greatest magnitude of T cell responses was in Bw4/Bw4, which was significantly higher than Bw6/Bw6 and Bw4/Bw6; * and **, significant difference of P=0·05(*) and P=0·01(**) by one-way analysis of variance analysis.
