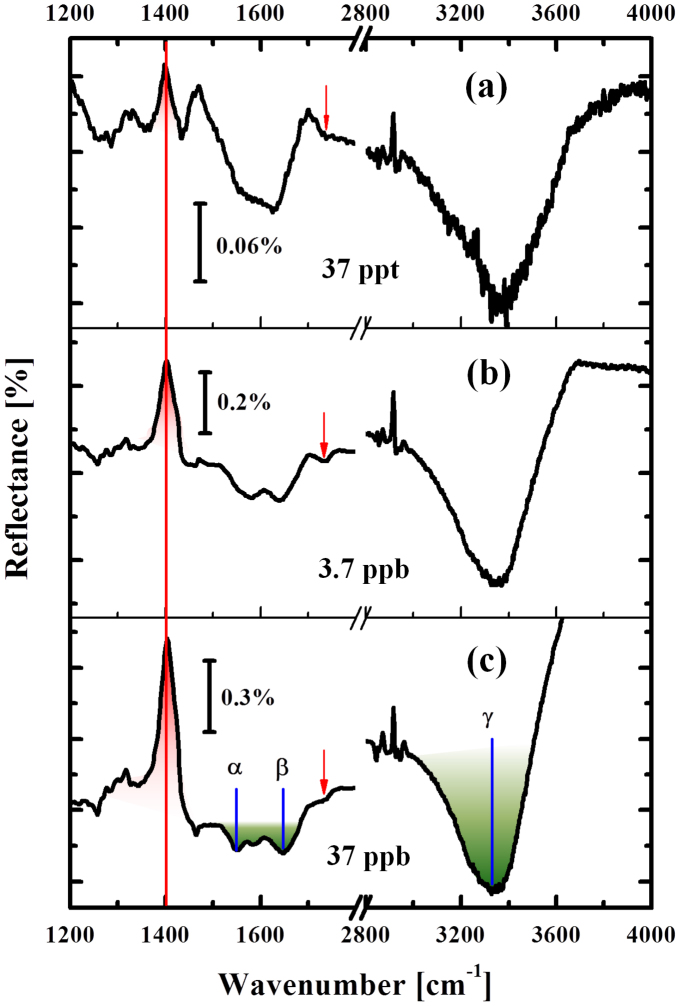
Figure 4. Detection of the presence of ionic mercury in environmental water.
Spectral evolution shown as a function of Hg2+ concentration (added into water of Lake Kasumigaura). DNA-related signal is indicated by red peak and small red arrows. Green absorption feature shows the residual biomolecules in the lake water. Note that the scale of reflectance is different for each sub-graph.

