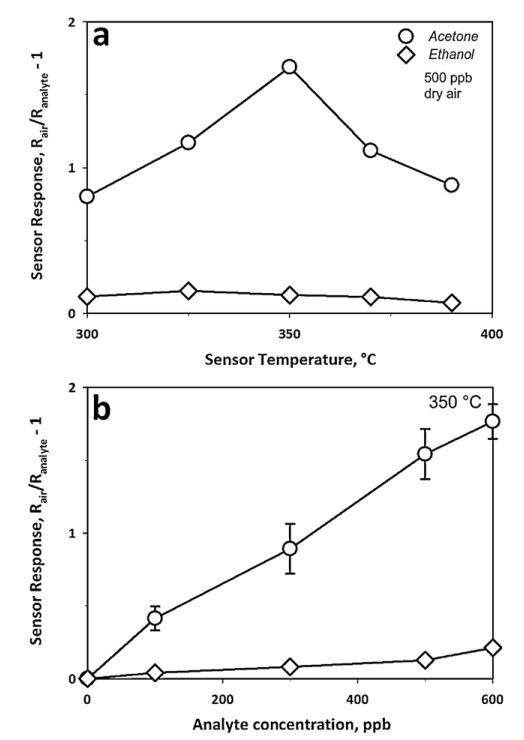
Fig. 2.
Sensor response (a) to 500 ppb acetone (circles) or ethanol (diamonds) as a function of sensor temperature in dry air, with an optimum at 350 °C; and (b) to different acetone (circles) and ethanol (diamonds) concentrations at 350 °C. The error bars represent the variability of sensor response to acetone (circles) by three 10 mol% Si-doped WO3 sensors.

