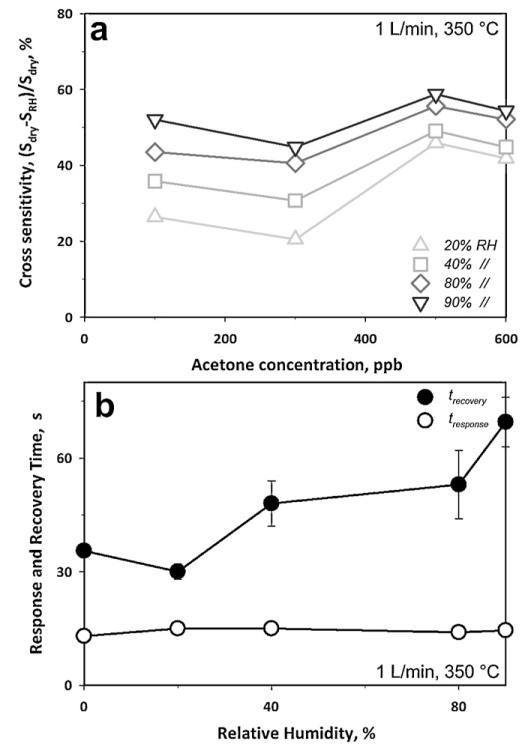
Fig. 4.
(a) Sensor response upon exposure to increasing acetone concentration at various RH. The sensor response to acetone decreased with increasing RH showing high CS (54%) between 0 and 90% RH. Between 80 and 90% RH, however, the CS was only 4.5% showing the robustness of such sensors at the typical RH of the human breath. (b) Response time to 100 ppb (open circles) and recovery time to 600 ppb (filled circles) acetone as a function of RH at 350 °C.

