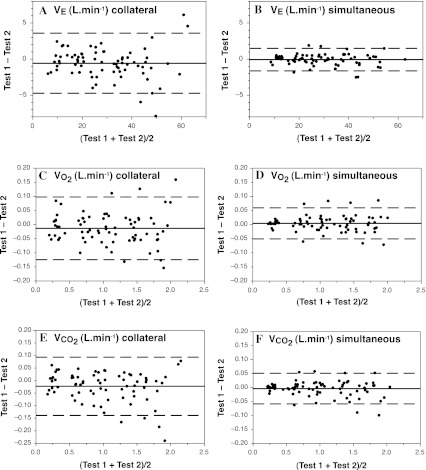
Fig. 2.
Bland–Altman plots from the collateral (a, c, e) and simultaneous (b, d, f) tests, showing the error scores for the two gas analysis systems (Test unit 1 − Test unit 2); data shown for V E (a, b), VO2 (c, d), and VCO2 (e, f). Solid horizontal line indicates the mean error, whilst the dashed horizontal lines indicate the 95 % LOA

