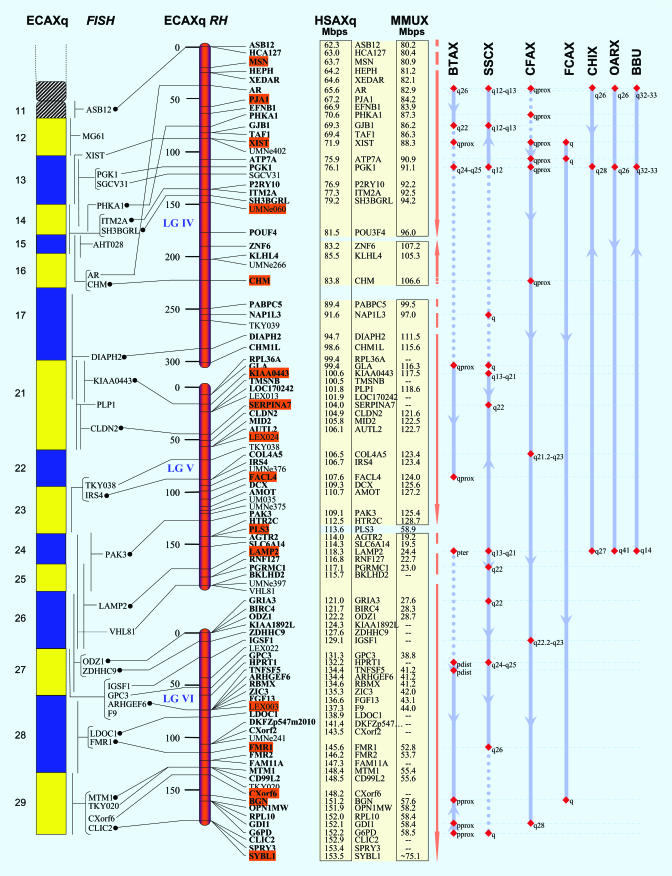
Fig. 1.
High-resolution RH and comparative map of the long arm of horse X chromosome (ECAXq). A complete map and detailed figure legend are published as Fig. 3. From left to right are a schematic drawing of ECAXq, FISH localizations, RH map showing the distance and order of loci (ECAXqRH), and comparative location of orthologs in human (HSA) and mouse (MMU), followed by comparative map information on orthologs mapped in cattle (BTA), pig (SSC), dog (CFA), cat (FCA), goat (CHI), sheep (OAR), and river buffalo (BBU).

