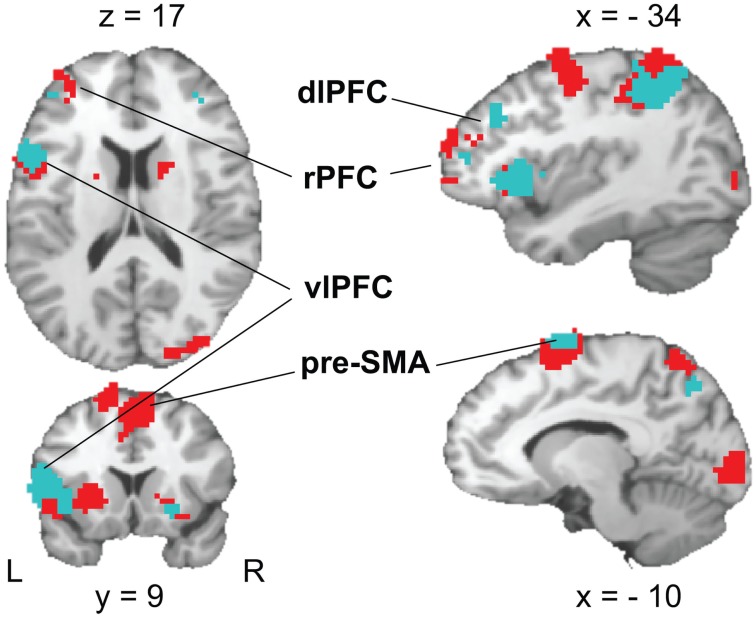
Figure 6.
Activation patterns in brain areas associated with rule cue-induced pre-target processes. A FDR-corrected (p < 0.05, k ≥ 25 voxels) T-maps contrasting RULE > NON (red color) and RULE > POS (cyan color, superimposed) are plotted on a single subject Colin brain in MNI space (highlighted areas of interest correspond to Talairach peak voxel coordinates in Tables 2 and 4).

