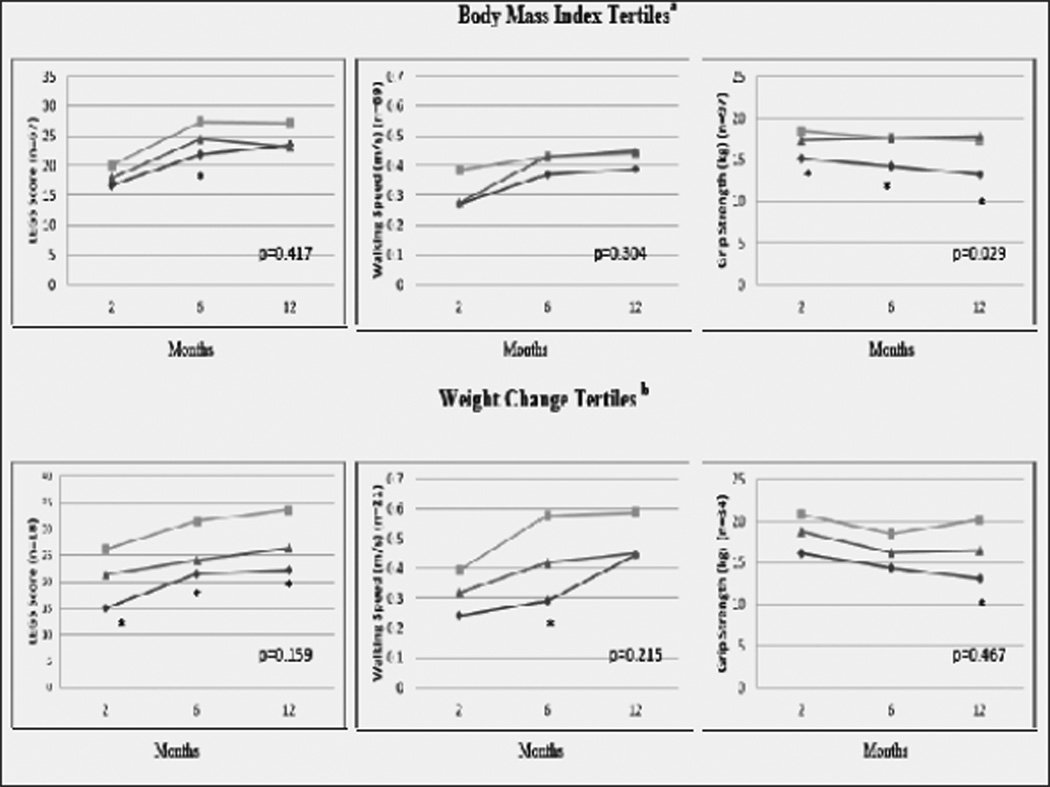
Figure 2.
Physical Function at 2, 6, and 12 months following hip fracture by tertiles of body mass index and weight change
The p value displayed on graphs represents the statistical test that all differences between all three trajectories=0; *p<0.05 for the difference between low and medium tertiles; LEGS=Lower Extremity Gain Scalea. Low tertile (14.8, 20.5 kg/m2), Med tertile (20.5, 24.0 kg/m2), High tertile (24.6, 33.2 kg/m2); b. Low tertile (−10.4, −4.8%); Med tertile (−4.3, −0.4%), High tertile (−0.3, 4.8%)

