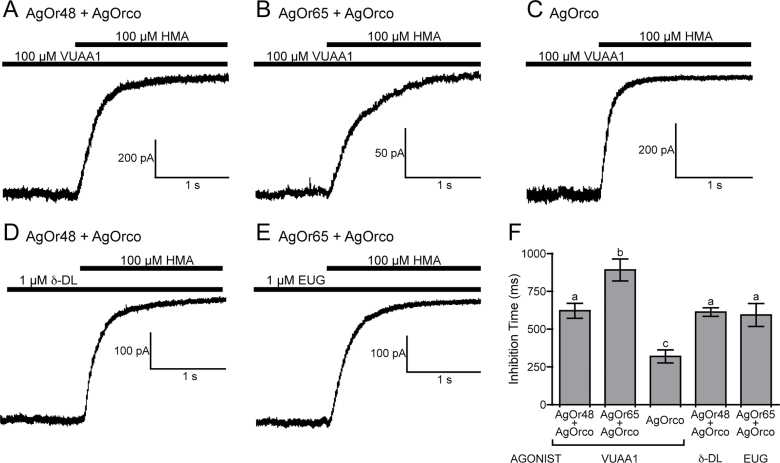
Figure 6.
The rate of current inhibition by HMA varies among AgOr complexes. (A-E) Representative whole-cell currents of steady-state activation by either VUAA1 (100 µM) or odorant (1 µM) that were subsequently blocked by application of 100 µM HMA. (F) Histogram of the inactivation time (mean ± SEM, n = 5), or the time required to reduce the steady-state current from 90% maximal current to 10%, of the AgOr complexes. The holding potential for each recording was −60 mV, and the solutions were Extracellular 2 and Internal 2. Statistically different groups determined by an ANOVA and a Bonferroni post test (P < 0.05) are denoted by a, b, and c.

