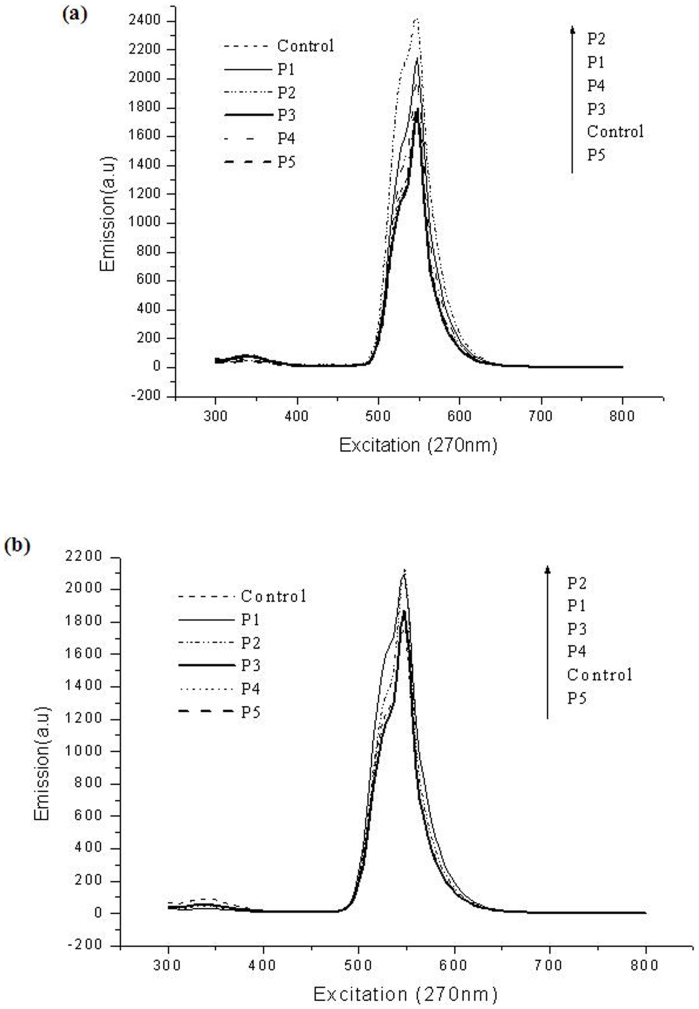
Figure 5.
(a), Fluorescence spectra of the AO stained P.aeruginosa control cells and cells incubated with 8.5 mg/L concentrations of P1, P2, P3, P4 and P5 Pt NPs for 6 h. (b), Fluorescence spectra of the AO stained P.aeruginosa control cells and cells incubated with 15 mg/L concentrations of P1, P2, P3, P4 and P5 Pt NPs for 6 h.

