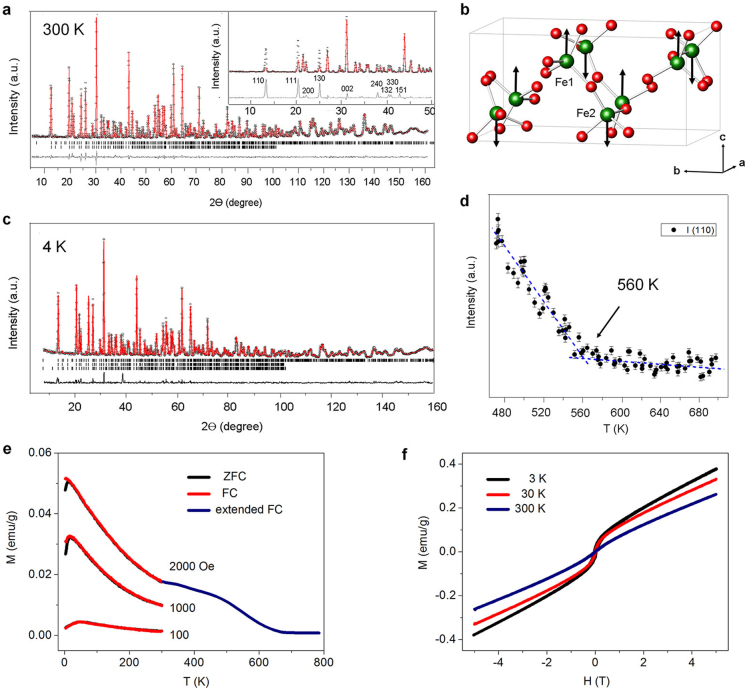
Figure 3. Magnetic structure and weak ferromagnetism of KBiFe2O5.
(a) Experimental (circles), calculated (line), and difference (“noise” at bottom) NPD profiles for KBiFe2O5 at 300 K. Vertical bars indicate calculated positions of Bragg peaks from the nuclear phase (upper) and the magnetic phase (lower). λ = 1.5403 Å. Space group P21cn, No. 33, a = 7.9855(1) Å, b = 11.8225(1) Å, c = 5.7396(1) Å, V = 541.87(1) Å3; Rwp = 0.0373, Rp = 0.0316, χ2 = 1.230. Magnetic symmetry of Shubnikov group: P21′cn′ with Fe moment of 3.77(2) μB along c-axis direction. (Inset: Refinement with nuclear phase only. Difference profile shows reflections from magnetic phase). (b) Magnetic and crystal structure of KBiFe2O5 (P21cn cell). (c) Experimental (circles), calculated (line), and difference (“noise” at bottom) NPD profiles for KBiFe2O5 at 4 K under 6 T magnetic field. Vertical bars indicate the calculated positions of Bragg peaks from the nuclear phase P21cn (upper), from the G-type antiferromagnetic phase P21′cn′ (lower), and from the ferromagnetic phase P21c′n′ at 6 T (bottom). λ = 1.5403 Å. Rwp = 0.0619, Rp = 0.0490, χ2 = 1.348. (d) Temperature dependence of the magnetic (110) reflection indicative of a magnetic phase transition at ~560 K. (e) Magnetization (M) measured at three fields showing near coincidence of ZFC and FC data except at the lowest temperature at 1 kOe and 2 kOe. Magnetic transition at 2 kOe occurs at about 550 K. (f) Magnetization-field (H) curves at 3 K, 30 K and 300 K.

