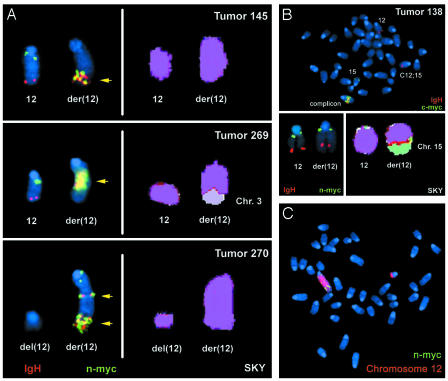
Fig. 3.
IgH and N-myc are coamplified on chromosome 12. (A) Representative FISH (Left) and SKY (Right) analyses of three tumors (AP 145, AP269, and AP270) exhibiting N-myc amplification by Southern blotting. The IgH FISH probe is red, the N-myc probe is green, and regions of coamplification are highlighted by yellow arrows. (B) Representative FISH (Upper, Lower Left) and SKY (Lower Right) analyses of tumor AP138 that exhibits c-myc amplification by Southern blotting. The IgH FISH probe is red, and the c-myc (Upper) or N-myc (Lower Left) is green. (C) Representative metaphase from AP270 analysis with a chromosome 12 paint (red) and the N-myc FISH probe (green).

