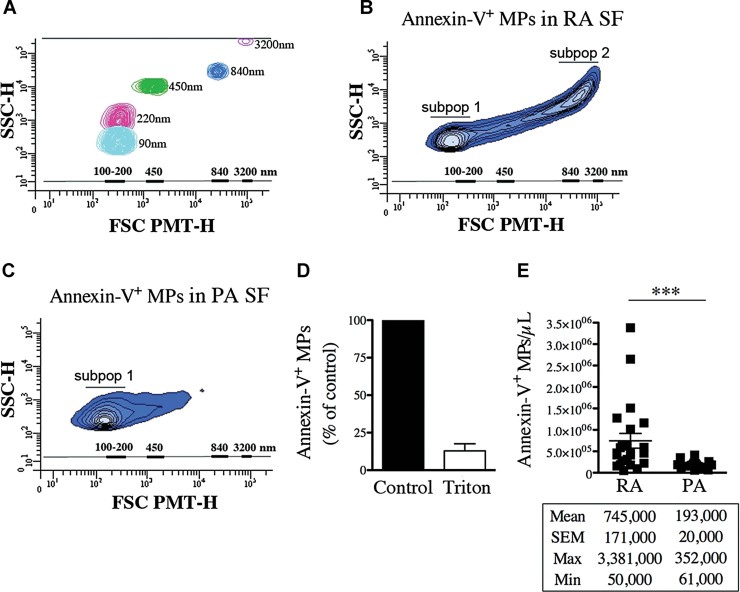
Figure 1. MPs are heterogeneous in size and are more abundant in RA compared to PA SF.
- A. Acquisition of fluorescent Sky Blue microspheres of 40–90 nm (mean = 90 nm, in cyan blue), 100–300 nm (mean = 220 nm, in pink), 400–600 nm (mean = 450 nm, in green), 700–900 nm (mean = 840 nm, in blue), 2500–4500 nm (mean = 3200 nm, in violet) diameter on a flow cytometer Canto II modified with a FSC-PMT small particles option. A scale bar ranging from 100 to 3200 nm based on the microsphere sizes (FSC-PMT) is presented and used to determine the relative dimensions of the MPs.
- B,C. Representative FSC-PMT and SSC portrayals of the Annexin-V+ events detected in RA SF (B) and PA SF (C) revealing the dimension diversity of the MPs. The relative dimensions of the MPs are presented according to size-defined microsphere calibrations. Two major subpopulations (subpop 1 and 2) are detected in RA SF (B) while only one (subpop 1) is observed in PA SF (C) are identified on the graphs.
- D. Triton sensitivity of the MPs in RA SF detected using Annexin-V labeling presented as % of untreated (control).
- E. Flow cytometric quantifications of the Annexin-V+ MPs contained in RA and PA SF (n = 23 RA and n = 18 PA ***p = 0.0004). Statistical analyses are presented under the graph. Data are mean ± SEM.

