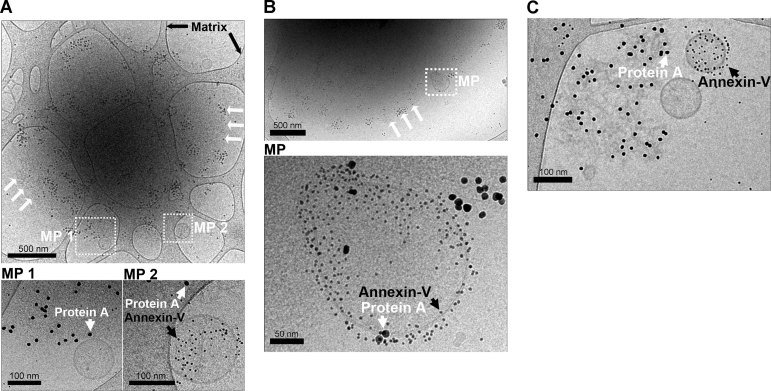
Figure 2. Visualization of the mpICs in RA SF.
Cryo-TEM detection of immunoglobulins and phosphatidylserine exposing MPs using, respectively protein A-conjugated gold nanoparticles (10 nm) and Annexin-V-conjugated gold nanoparticles (4 nm).
- A,B. Representative observations obtained using RA SF in which MPs [white boxes labelled MP (MP 1 and MP 2 (A) and MP (B)] were colocalized with ∼2 µm diameter mpICs. White arrows indicate the edge of the IC where MPs were detected. Black arrows indicate the carbon matrix of the perforated support film used for TEM. Insets (bottom panels) include individual MPs. Immunoglobulins detected using protein A conjugated nanospheres (10 nm) are indicated with white arrowheads and MPs detected using Annexin-V conjugated nanospheres (4 nm) are indicated by black arrowheads. Note that some MPs were Annexin-V negative.
- C. Relatively smaller mpICs were also visualized. White and black arrowheads indicate immunoglobulins and phosphatidylserine, respectively. Scale bars are presented under each panel.

