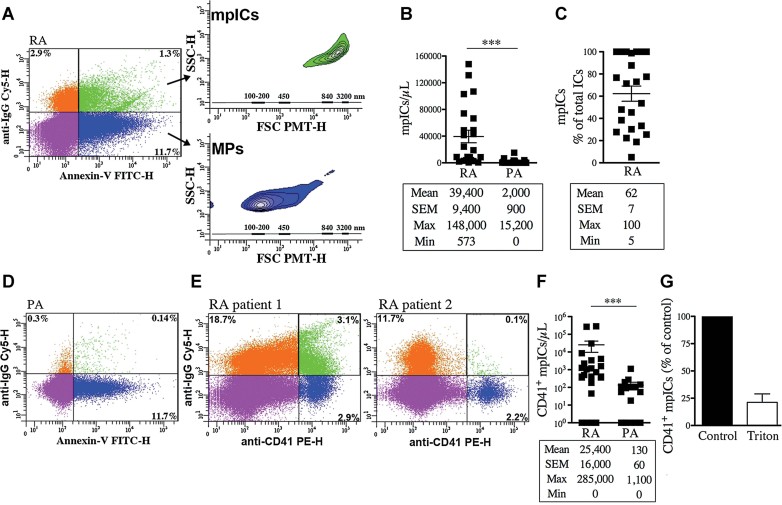
Figure 3. MPs, including platelet MPs, in RA SF form mpICs.
- FSC-PMT and SSC dot plots of representative RA SF labelled with a combination of FITC-conjugated Annexin-V and Cy5-conjugated anti-IgG to demonstrate the presence of IgG on surface of Annexin-V+ MPs. The four-quadrant gates were positioned according to the isotypic controls. The MPs (Annexin-V+-IgG−) in blue show dimensions ranging mostly from 100 to 300 nm (lower inset) while the mpICs (Annexin-V+-IgG+) in green have dimensions from 700 to 3000 nm (upper inset). The relative diameters are presented according to size-defined microsphere calibrations.
- Quantifications of the mpICs contained in RA and PA SF (n = 23 RA and n = 18 PA ***p < 0.0001).
- Quantifications of the mpICs relative to the total amounts of detectable ICs in RA SF (n = 23). The statistical analyses are presented under each graph. Data are mean ± SEM.
- FSC-PMT and SSC dot plots of representative PA SF labelled with a combination of FITC-conjugated Annexin-V and Cy5-conjugated anti-IgG.
- FSC-PMT and SSC dot plots of RA SF patients labelled with PE-conjugated anti-CD41 and Cy5-conjugated anti-IgG. The four-quadrant gates were positioned according to the isotypic controls. The presence of CD41+ mpICs is evidenced by the dual expression of CD41 and IgG by MPs (green region). RA SF from two patients are presented to illustrate the heterogeneity that exists among the patients.
- Quantifications of the CD41+ mpICs in RA and PA SF (n = 25 RA and n = 18 PA ***p = 0.0006). The statistical analyses are presented under each graph. Data are mean ± SEM.
- Triton sensitivity of the CD41+ mpICs contained in RA SF presented as % of untreated (control) CD41+ mpICs.

