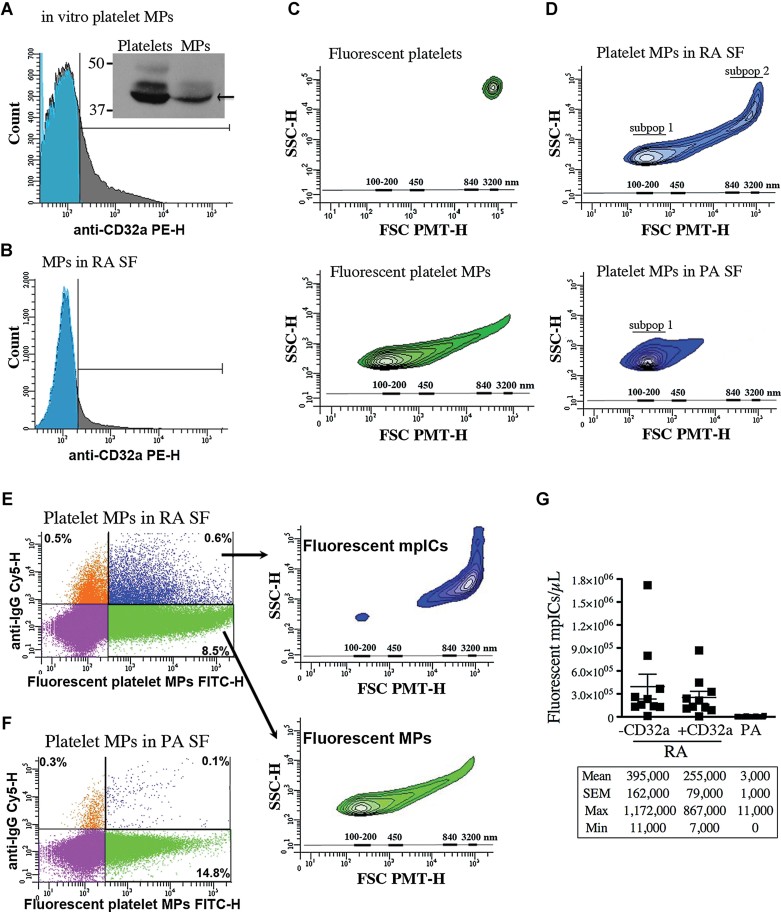
Figure 4. Platelet MPs form mpICs independently of CD32a.
- A,B. The expression of CD32a by platelet MPs was determined by hs-FCM and Western blot analysis (inset in A). The platelet MPs were generated in vitro upon platelet GPVI stimulation (A) and the endogenous MPs in RA SF were detected using Annexin-V (B). Blue: isotype; grey: specific CD32a labeling (n = 3).
- C. FSC-PMT and SSC profiles of the fluorescent platelets (top panel) and platelet MPs (bottom panel) (n = 10). The relative dimensions are presented according to size-defined microsphere calibrations.
- D–G. Results obtained following the incubation of exogenous fluorescent platelet MPs in RA and PA SF (n = 10 RA and n = 18 PA). (D) Representative FSC-PMT and SSC plots obtained using RA (top) and PA SF (bottom). Two subpopulations (subpop) (1 and 2) were detected in RA and only one in PA SF (1). (E,F) hs-FCM evaluation of the presence of IgG on surface of MPs upon incubation in RA (E) and PA SF (F) using Cy5-conjugated anti-IgG antibody. The four-quadrant gates were positioned according to the isotypic controls. (E) MPs (in green) are IgG− and show dimensions ranging from 100 to 300 nm (lower inset) while the mpICs (in blue) have dimensions ranging from 700 to 3000 nm (upper inset). (D,E) The relative dimensions are presented according to size-defined microsphere calibrations. (G) hs-FCM quantifications of the mpICs were determined in absence (1st and 3rd column) or presence (2nd column) of CD32a blocking antibody (1st and 2nd column p = 0.4478 (unpaired t-test), 1st and 3rd column ***p < 0.0001). Statistical analyses are presented under the graphs. Data are mean ± SEM.

