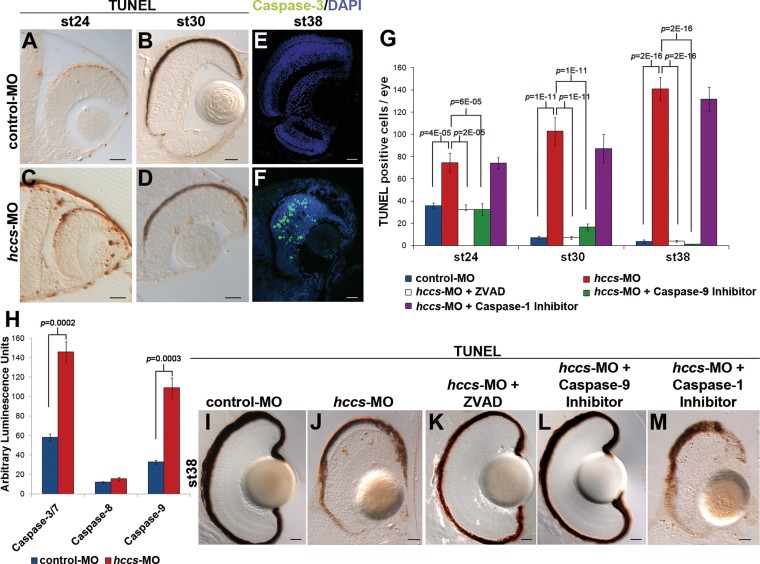
Figure 4. Caspase-9 dependent cell death underlies microphthalmia in hccs-deficient embryos.
- A–D. TUNEL assays on retinal sections. Embryos injected with control-MO (A, B) and with hccs-MO (C, D) at st24 and st30.
- E, F. Immunofluorescence analysis with an anti-active-caspase-3 antibody on control-MO (E) and hccs-MO injected embryos (F) at st38.
- G. Number of TUNEL positive cells/eye (n ≥ 5 embryos/stage; Error bars are SEM; p-values were calculated by ANOVA).
- H. Caspase activation in control and morphant embryos measured by cleavage of a synthetic substrate and release of luciferin (DEVD-aminoluciferin for caspase-3, LETD-aminoluciferin for caspase-8, and LEHD-aminoluciferin for caspase-9). Histograms show the relative levels of emitted signals displayed in arbitrary units of luminescence. Values represent means of four samples. Each sample represents a group of 20 embryos (error bars are SEM; p-values were calculated by unpaired, two-tailed Student's t-test).
- I–M. TUNEL assays on st38 embryos injected with control-MO (I) and hccs-MO alone (J), in association with the pan-caspase inhibitor (ZVAD) (K) or with the caspase-9 inhibitor (L), or with the caspase-1 inhibitor (M) (n = 100 embryos for each treatment). The pan-caspase inhibitor and the specific caspase-9 inhibitor rescue the increased levels of cell death (G, K, L). Scale bars: 20 µm.

