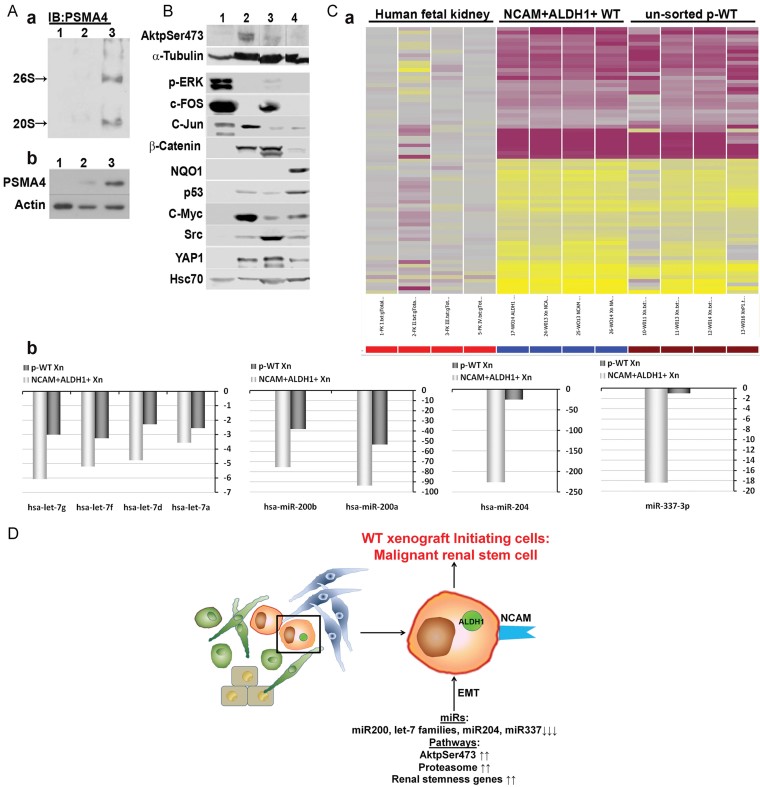
Proteasomal levels were examined in a primary tumour (1) compared to un-sorted p-WT Xn (2) and p-WT Xn generated from NCAM+ALDH1+ cells (3), showing increased levels in the latter. Proteasomal complexes were analysed by (a) nondenaturing page analysis and total proteasomal subunit protein levels and by (b) immunoblot analysis of polyacrylamide-SDS gel.
Immunoblot analysis of polyacrylamide–SDS gel for the expression of the following proteins: AKTpSer473, p-ERK, c-FOS, c-JUN, β-Catenin, NQO1, p53, c-MYC, SRC and YAP1 in parental tumour (1), NCAM+ALDH1+ derived Xn (2), foetal kidney (3) and rhabdoid tumour (4). Showing that AKTpSer473, but not p-ERK and c-FOS, are differentially expressed in NCAM+ALDH1+ derived p-WT Xn.
Agilent microRNA microarray comparison of un-sorted p-WT Xn, NCAM+ALDH1+ derived p-WT Xn and human foetal kidneys. (a) Heat map of 71 miRNAs differentially expressed between p-WT Xns and human foetal kidneys. Expression pattern was similar among all p-WT Xns, with 35 down-regulated and 36 up-regulated microRNAs (miRs) compared to the hFK tissues. (b) Expression of microRNA families let-7 and 200 (miRs 200a and 200b), miR-204 and miR-337 is markedly reduced in NCAM+ALDH1+ derived p-WT Xn compared to un-sorted p-WT Xn and human foetal kidney.
Suggested schematic representation of the regulatory pathways governing WT CIC phenotype and function. For array experiments four sources (n = 4) for each tissue type were used.

