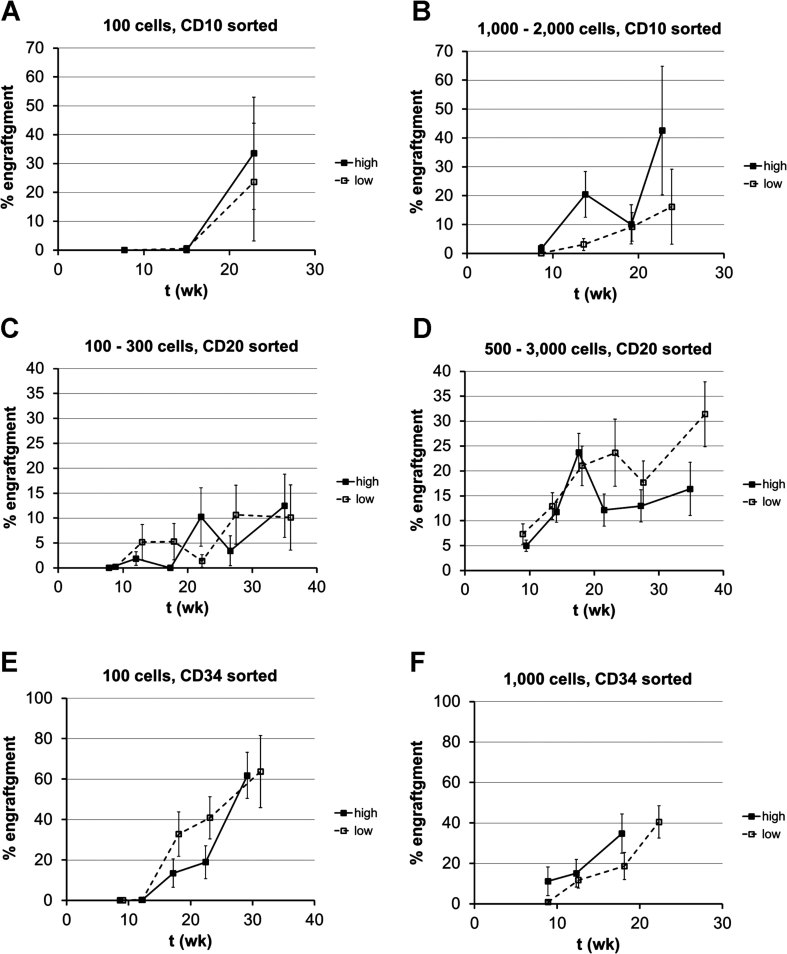
Figure 4. Engraftment kinetics of purified B-ALL subpopulation as assessed by sequential bone marrow punctures.
Mice from all limiting dilution experiments were pooled, as the number of mice in each individual transplantation experiment was too low for the analysis. Data are mean percentage of engraftment with bars showing standard error of the mean.
- A,B. Engraftment kinetics of CD10high and CD10low cells after transplantation of 100 (n = 4) or 1000–2000 blasts (n ≥ 4).
- C,D. Engraftment kinetics of CD20high and CD20low cells after transplantation of 100–300 (n ≥ 8) or 500–3000 blasts (n ≥ 21).
- E,F. Engraftment kinetics of CD34high and CD34low cells after transplantation of 100 (n ≥ 6, last points n = 2 for CD34high and n = 3 for CD34low) or 1000 blasts (n ≥ 9).

