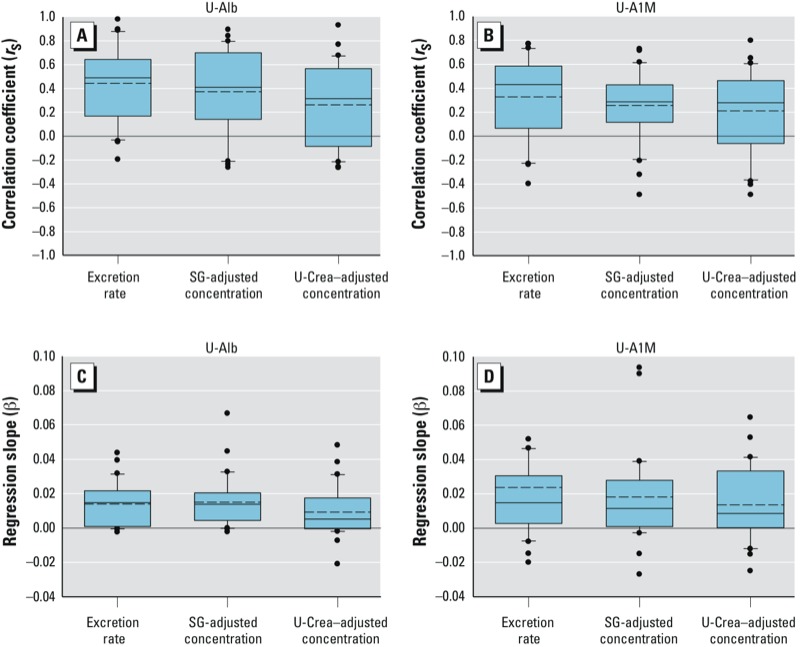
Figure 2.

Distributions of individual Spearman correlation coefficients (rS; A,B) and individual regression coefficients (β; C,D) for associations between U-Cd and U-Alb (A,C), and U-Cd and U-A1M (B,D), calculated for 30 individual participants [individual values based on 6 samples per day over 2 days for each participant, 354 total samples (1 participant had 6 samples only)]. Boxes indicate 10th and 25th percentiles; dotted line, mean; solid line, median; and whiskers, 75th and 90th percentiles across all participants, with dots indicating outliers. Excretion rates in µg/hr for U-Cd, mg/hr for U-Alb and U-A1M; SG-adjusted concentrations in µg/L for U-Cd, mg/L for U-Alb and U-A1M; U-Crea–adjusted concentrations in µg/g creatinine for U-Cd, mg/g creatinine for U-Alb and U-A1M. All measures deviate significantly from 0 (p < 0.05).
