
Figure 1.
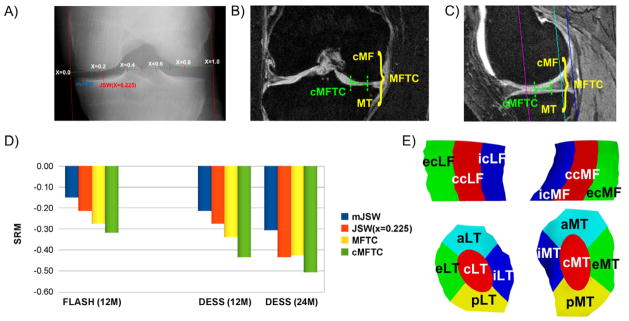
A) Illustration showing the radiography-based measurement of the minimal joint space width (mJSW) and of the joint space width at the central fixed location JSW(x=0.225). B) Illustration showing the coronal FLASH MRI-based measurement in the medial femorotibial compartment (MFTC) and in the most sensitive subregion of the MFTC (cMFTC = central subregion of MFTC). C) Illustration showing the sagittal DESS MRI-based measurement in the MFTC and in the most sensitive subregion of the MFTC (cMFTC). D) Bar graph showing the sensitivity to change (standardized response mean = SRM = mean change/standard deviation of the change) for mJSW, MFTC, and the most sensitive fixed location JSW(x) in the FLASH sample over 12 months (12M, JSW(x)=JSW(x=0.25)), in the DESS sample over 12M (JSW(x)=JSW(x=0.225)), and in the DESS sample over 24 months (24M, JSW(x)=JSW(x=0.225)). The DESS sample over 12 months is a sub-sample of the 24 months cohort, for which a complete set of 12 months measurements was available. E) Illustration showing the central (c), external (e), internal (i), anterior (a), and posterior subregions (p) computed in the medial (MT) and lateral tibia (LT) and in the central, weight-bearing part if the medial (cMF) and lateral (cLF) femoral condyle (only central, external, and internal subregions).