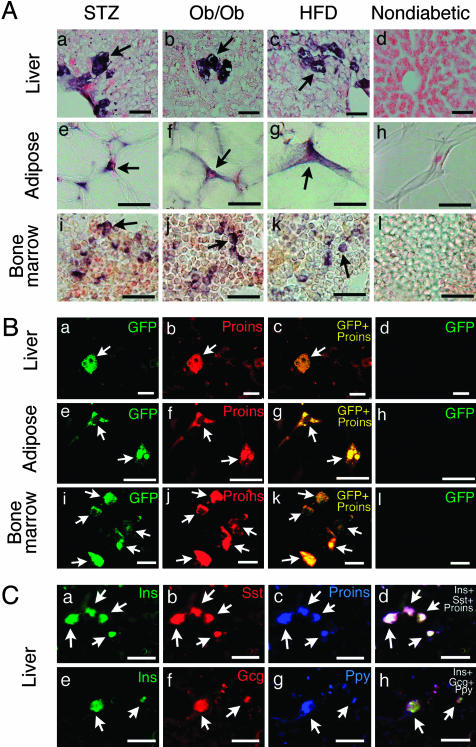
Fig. 2.
(A) Proinsulin-positive cells (arrows) in the liver (a–d), abdominal adipose tissue (e–h), and bone marrow (i–l) of STZ (a, e, and i), ob/ob (b, f, and j), and high-fat diet (HFD, c, g, and k) diabetic mice and nondiabetic mice (d, h, and l). In nondiabetic mice, proinsulin-positive cells were not found in the liver (d), adipose tissue (h), or bone marrow (l). (Scale bars, 25 μm.) (B) Overlap images of GFP/proinsulin in the liver (a–d), adipose tissue (e–h), and bone marrow (i–l) from STZ-induced diabetic (a–c, e–g, and i–k) and nondiabetic (d, h, and l) MIP-GFP mice. GFP and proinsulin signals completely overlap (arrows). (Scale bars: 25 μm, a–d; 20 μm, e–h; 10 μm, i–l.) (C) Overlap staining of insulin/somatostatin/proinsulin (a–d) and insulin/glucagon/Ppy (e–h) in the liver of ob/ob mice. Insulin, proinsulin, somatostatin, glucagon, and Ppy colocalize in most of the cells (arrows). (Scale bars, 50 μm.)

