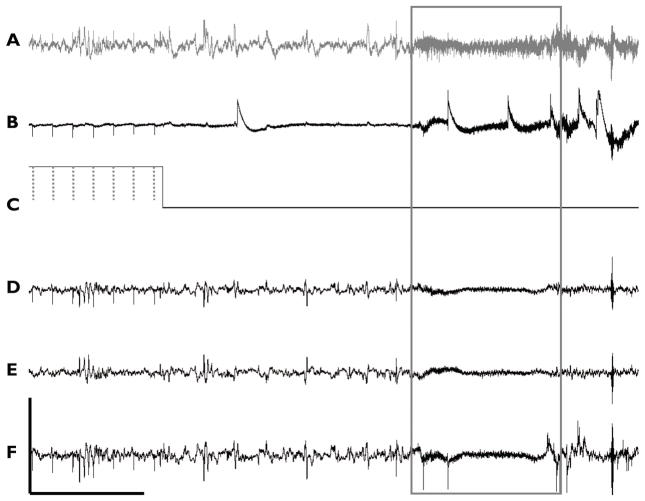
Figure 5. Stimulation during chronic recording.
Six-channel recordings during periods of cycling stimulation. Channels of A) hippocampus DPE, B) EMG, C) stimulation indicator, D) Left EEG, E) Right EEG, and F) Parietal EEG, are shown, with seizure (boxed) as identified by high frequency components across all channels as well as by motor seizure activity seen in video monitoring. Stimulus artifacts from square wave pulses (dotted line) are easily identifiable over recordings, with the exception of right EEG (Scale: 50μV, 5s).

