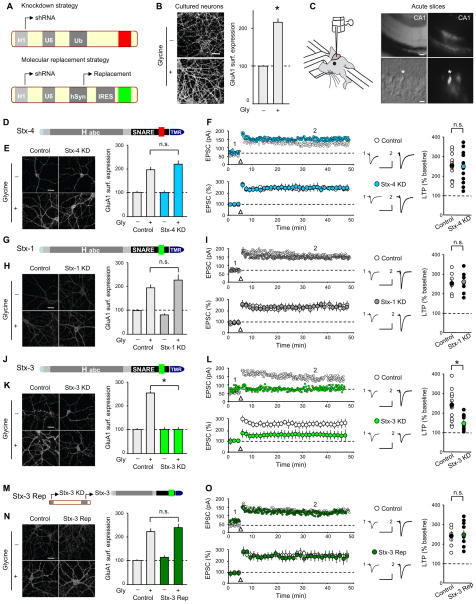
Figure 1. Postsynaptic Syntaxin-3 is Required for Surface AMPAR Delivery During LTP.
(A) Schematics of lentivirus vectors. (B) Images of cultured hippocampal neurons (left panels) and summary graph (right panel) showing surface GluA1 staining following glycine treatment. (C) Schematic showing in vivo injection of lentiviruses. DIC (left panels) and fluorescence (right panels) images from acute hippocampal slice showing GFP-expressing CA1 pyramidal cells (upper/lower panel scale bar: 50 μm/10 μm). (D) Schematic of Stx-4 showing its functional domains; (Habc, Habc domain; SNARE, soluble NSF-attachment protein receptor motif; TMR, transmembrane region; red indicates non-complexin binding sequence). (E) Sample images and summary graph (mean ± SEM) of glycine-induced changes in surface GluA1 in control and Stx-4 KD cultured neurons. (F) Sample experiments (top) and summary graphs (bottom) of LTP in control and Stx-4 KD CA1 pyramidal cells, both recorded from slices prepared from animals injected with Stx-4 shRNA lentiviruses. In this and all subsequent figures: arrow indicates tetanic stimulation; sample averaged EPSCs during the baseline (1) and 35 min post-LTP induction (2) are shown next to the LTP graphs. Right panel shows scatter plots of individual experiments with mean ± SEM indicated by symbol with different color. (G) Schematic of Stx-1 structure (complexin binding sequence is indicated in green). (H) Sample images and summary graph of glycine-induced changes in surface GluA1 in control and Stx-1 KD cultured neurons. (I) Sample experiments (top) and summary graphs (bottom) of LTP in control and Stx-1 KD CA1 pyramidal cells. Right panel shows scatter plots of individual experiments with mean ± SEM. (J) Schematic of Stx-3 (complexin binding sequence in green). (K) Sample images and summary graph of glycine-induced changes in surface GluA1 in control and Stx-3 KD cultured neurons. (L) Sample experiments (top) and summary graphs (bottom) of LTP in control and Stx-3 KD CA1 pyramidal cells. Right panel shows scatter plots of individual experiments with mean ± SEM. (M) Schematic illustrating the replacement strategy. (N) Sample images and summary graph showing rescue of glycine-induced increases in surface GluA1 by Stx-3in Stx-3 KD cultured neurons. (O) Sample experiments (top) and summary graphs (bottom) of LTP in control and interleaved Stx-3 Rep CA1 pyramidal cells. Right panel shows scatter plots of individual experiments with mean ± SEM. Scale bar in all panels represents 20 μm unless otherwise indicated. Calibration bars for sample EPSC traces represent 30 ms and 50 pA. In all panels, each bar represents mean ± SEM (*p<0.05). See also Figures S1 and S2.

