Fig. 5.
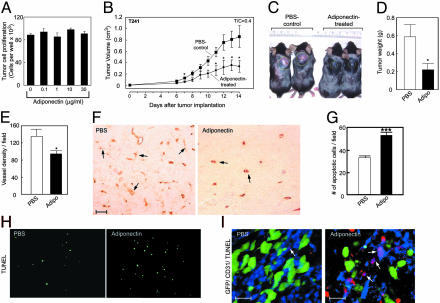
Suppression of tumor growth and induction of apoptosis. (A) T241 tumor cell growth rates in vitro in the presence and absence of mouse adiponectin. (B) Tumor volumes represent mean determinants of treated and control groups (+SEM). (C) Typical examples of tumor-bearing mice of the control or adiponectin-treated groups on day 14. (D) Tumor weights at necropsy. (E) Tumor vascular density was quantified as numbers of vessels per field (×10). (F) Tumor neovascularization was detected by using an anti-CD31 Ab in the adiponectin-treated and control tumors (×20). (Scale bar, 50 μm.) (G) Quantification of TUNEL-positive, apoptotic tumor cells. *, P <0.05; ***, P <0.001. (H) TUNEL staining (green) for visualization of apoptotic cells in tumor sections. (I) Whole-mount staining of tumor blood vessels [×20; green, GFP-T241 tumor cells; blue, CD31-positive tumor vessels; red, TUNEL-positive apoptotic cells (scale bar, 25 μm)]. Arrows indicate CD31/TUNEL double-positive structures.

