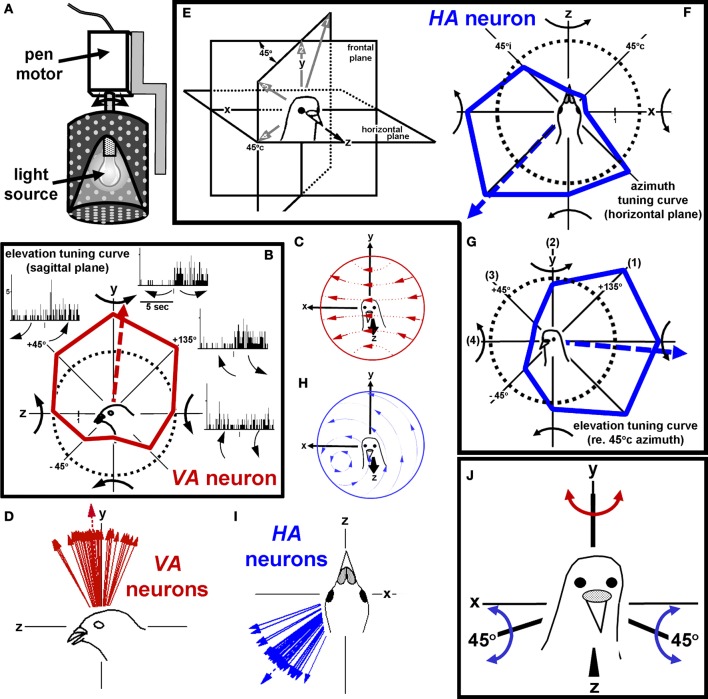
Figure 4.
Stimulating rotation-sensitive optic flow neurons in the pigeon vestibulocerebellum (VbC). (A) Shows a schematic of the planetarium projector used to simulate rotational optic flow. (B) Shows the elevation tuning curve for a vertical axis (VA) neuron. The flowfield that maximally stimulates VA neurons shown in (C), and the best axes of several VA neurons are shown in (D). (E–G) Shows axis tuning for an HA neuron. (F) Shows an azimuth tuning curve plotting the responses to rotation about axes in the horizontal (xz) plane. (G) Shows an azimuth tuning curve in a vertical plane that intersects the horizontal plane through 45° contralateral azimuth (45°c). The flowfield that maximally stimulates HA neurons in shown in (H), and the best axes of several HA neurons are shown in (I). (J) Shows the reference frame for rotational optic flow responses in the VbC. Considering both sides of the brain, it consists of three orthogonal axes: the vertical (y) axis and two horizontal axes oriented 45° to the midline. All responses in this and subsequent figures refer to recording from neurons in the VbC on the left side of the brain. These data are from Wylie and Frost (1993). See text for additional details.

