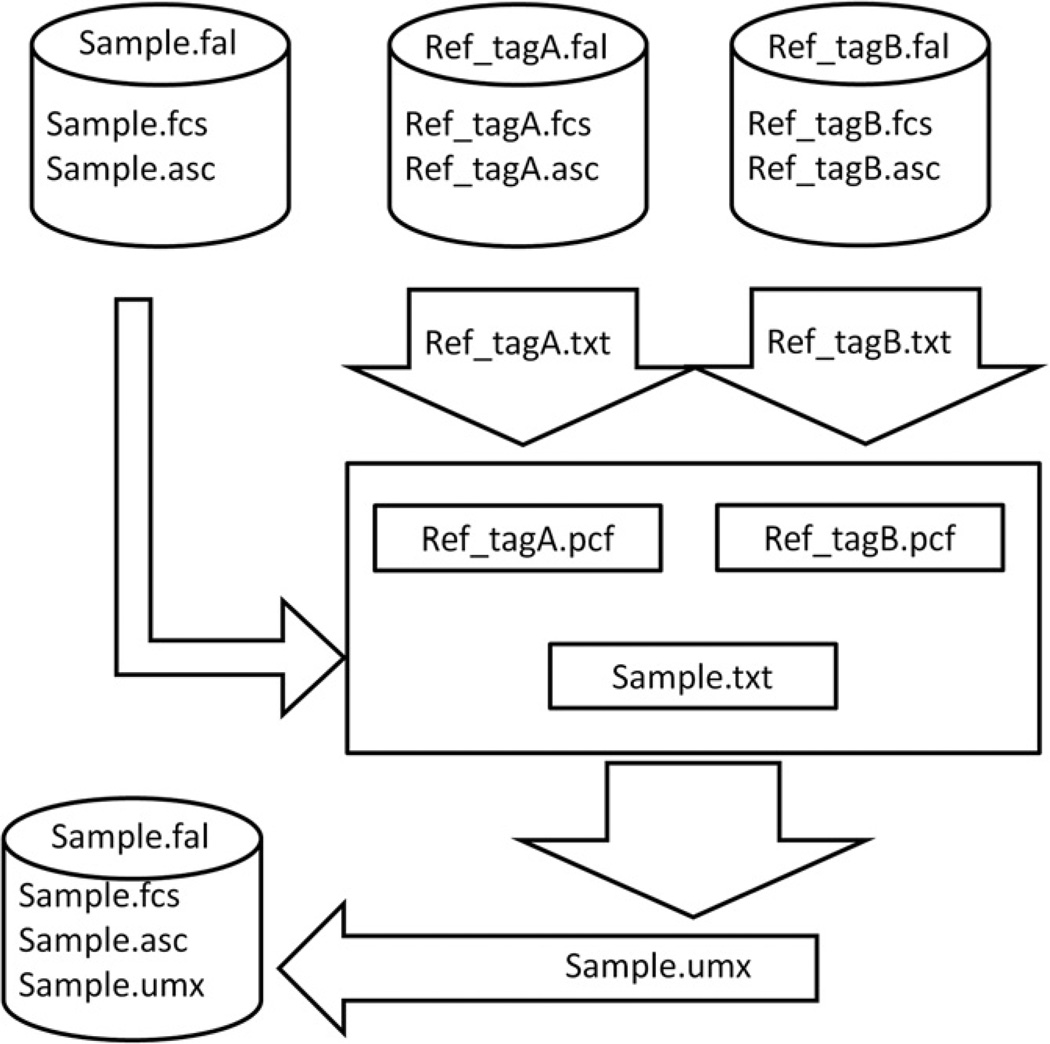
Fig. 3.
Schematic of the Raman flow cytometry data analysis workflow. Raman flow cytometry produces both conventional flow cytometry measurements such as forward and ninety degree light scatter (Sample.fcs), as well as complete SERS spectra from each particle (Sample.asc), which are bundled in a container file (Sample.fal). Data from beads labeled with a single tag (Ref_tagA.fal and Ref_tagB.fal) are analyzed to give reference spectra (Ref_tagA.txt and Ref_tagB.txt) that are used for spectral unmixing of the unknown sample spectra (Sample.txt). Spectral unmixing estimates the contribution of each tag to the unknown sample spectra for each particle. The amount of each tag on each particle in the sample (Sample.umx) is then saved as part of the Sample.fal file for analysis as a conventional flow cytometry parameter.

