
Fig. 1.
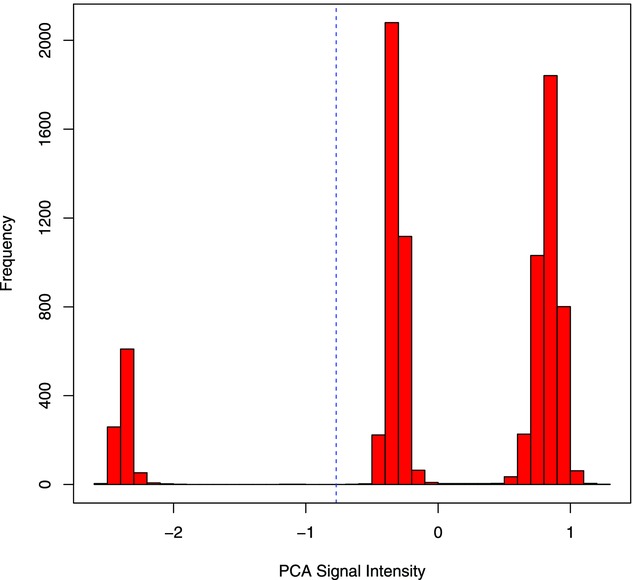
Raw CNV intensity distribution data using an array comparative genomic hybridisation (aCGH) array for n = 8,172 individuals at a common CNV deletion. The vertical dashed line shows the homozygous groups midpoint intensity. It is typical in aCGH data that the distance between the homozygous deletion (left most cluster, copy number 0) and the heterozygous class (middle cluster, copy number 1) is larger than the distance between the heterozygous and the normal copy number cluster (right most cluster, copy number 2). Consequently, if both parents have copy numbers 0 and 2, the offspring must have genotype 1, and the intensity in this group is systematically higher than the average of both parents.