
Figure 3.
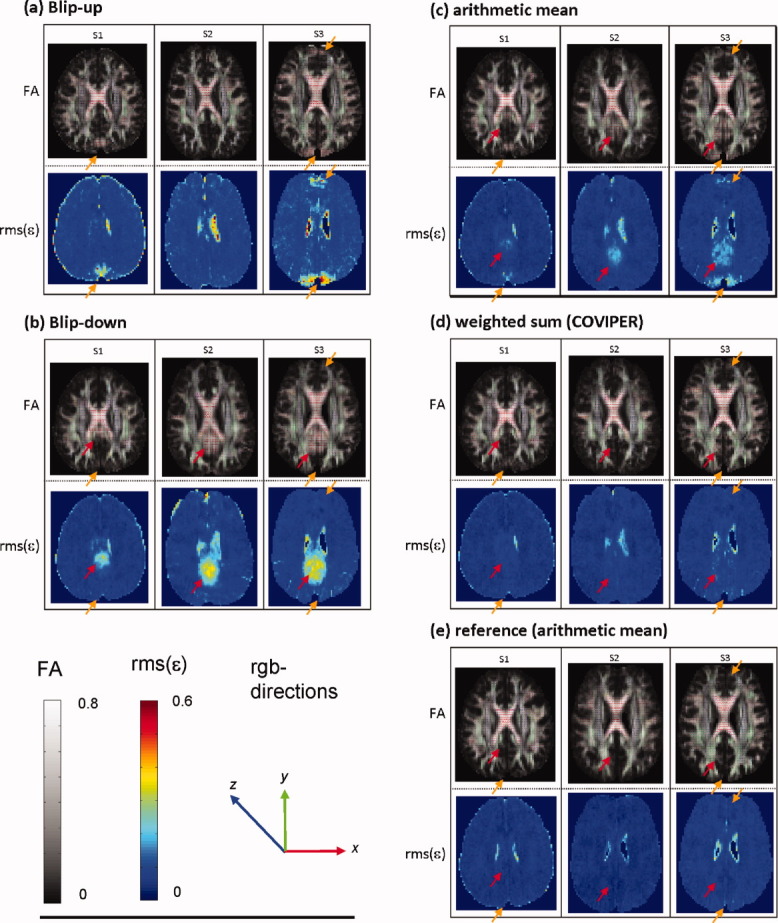
The FA (top row) in gray scale overlaid by the principled eigenvector in rgb-colors (red = x, green = y, and blue = z direction) and the root-mean-square of the error of the tensor fit rms(ε) in color (bottom row) using the DTI1± data sets of subject S1–S3: (a) blip-up, (b) blip-down, (c) the arithmetic mean of blip-up and blip-down, (d) the weighted sum of blip-up and blip-down data (COVIPER), and (e) the arithmetic mean of blip-up and blip-down from the DTI2± reference data. The vibration-induced bias in the FA maps (arrows) is clearly visible in the blip-up (a) and blip-down (b) data as well as in their arithmetic mean (c). The bias in FA is accompanied by an increased rms(ε) (arrows). COVIPER (d) reduced the bias in the FA maps and minimized the deviation from the reference FA map (e). Note that the location of the artifact is disjoint for the blip-up (yellow arrows) and blip-down (red arrows) data and it appears in similar regions across volunteers, although the extent and amplitude of the artifacts showed significant variation across volunteers. Furthermore, although less pronounced the artifact is visible in both locations (red and yellow arrows) when using the arithmetic mean combination (c).