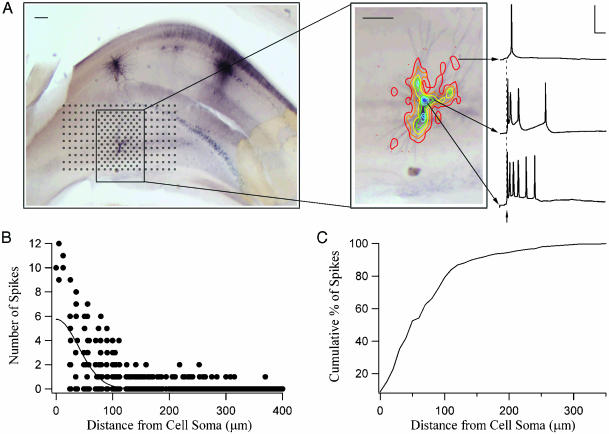
Fig. 1.
(A) A representative mouse hippocampal slice with biocytin-stained CA3 pyramidal cell. The black markers represent sites over CA3 that were photostimulated (25 or 50 μm apart). (Inset) Contour plots depicting the spiking response profile for this CA3 cell. The contours were generated by counting the number of spikes; each contour line represents from one spike (red = 1) to seven spikes (dark blue = 7). (Scale bar, 100 μm.) Sample traces are shown for some contours on the right. (Scale, 50 ms and 50 mV.) (B) Number of spikes generated by three CA3 neurons as a function of photostimulation distance from each cell's soma. (C) Cumulative percentage of spikes generated as a function of distance between the photostimulation site and the cell soma for all recorded CA3 cells (n = 8).

