
Figure 5.
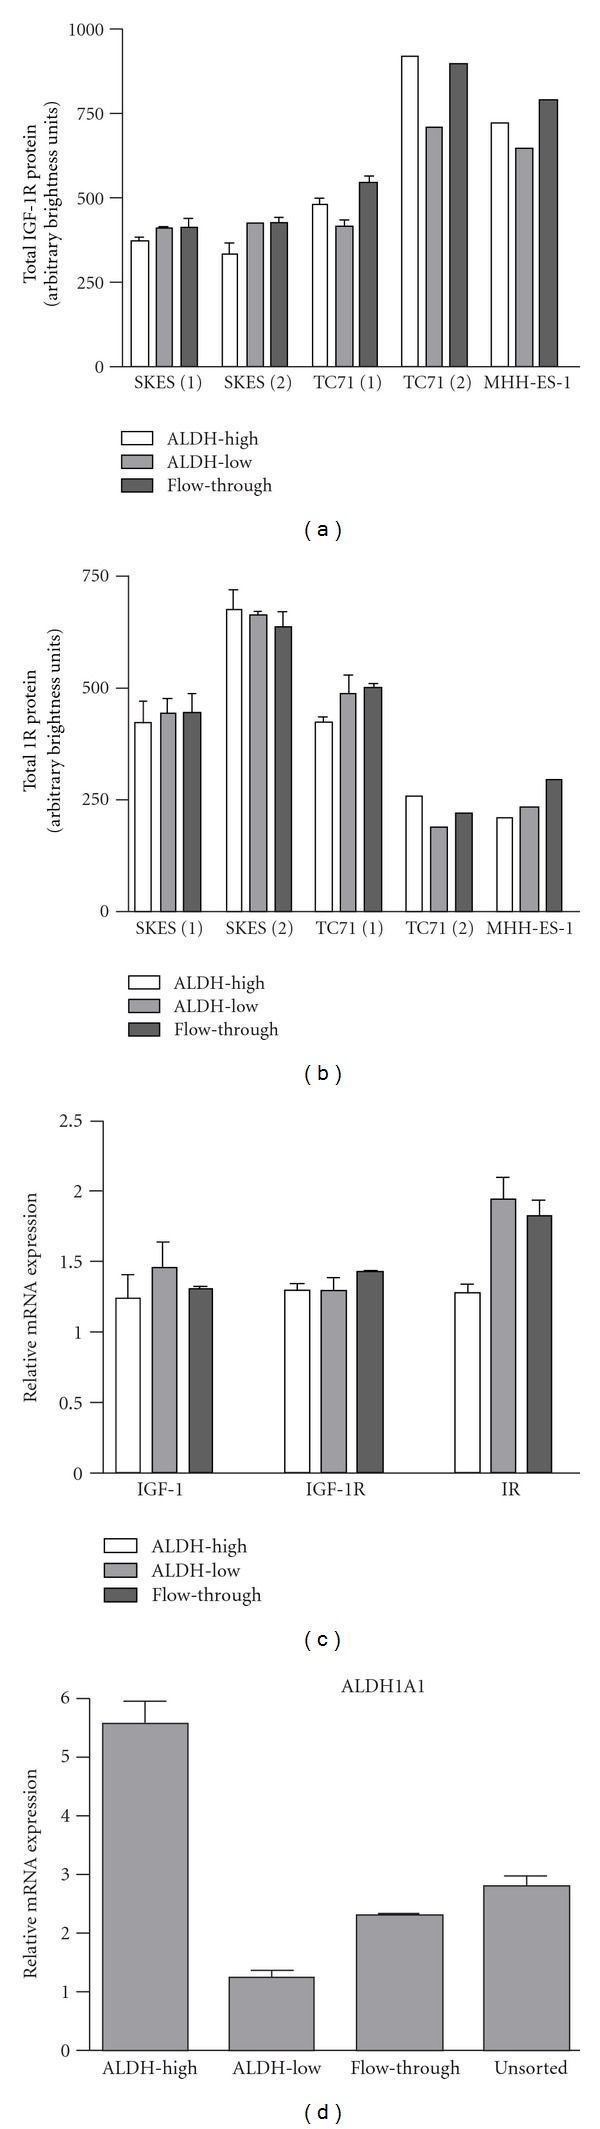
Total expression of IGF-1R pathway members in ES cell lines. (a) Luminex xMAP quantification of total IGF-1R protein in ALDH-sorted ES cells. (b) Luminex xMAP quantification of total IR protein in ALDH-sorted ES cells. (c) qRT-PCR quantification of IGF-1, IGF-1R, and IR mRNA transcripts in ALDH-sorted TC71 cells. (d) Quantification of ALDH1A1 mRNA in Aldefluor-sorted TC71 cells. Numbers in parentheses refer to replicate experiments.