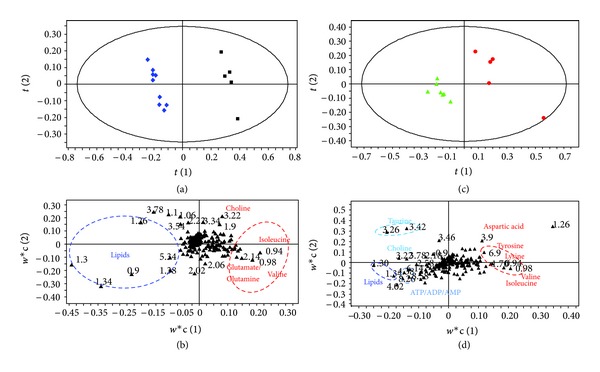
Figure 4.

PLS-DA (a) score plot and (b) loading plot based on the 1H NMR spectra of bone marrow samples from nonexposed (blue diamond, n = 9) and exposed female mice (black square, n = 5) (Q 2 = 0.92, R 2 = 99.6%, and A = 2). PLS-DA (c) score plot and (d) loading plot based on the 1H NMR spectra of bone marrow samples from nonexposed (green triangle, n = 7) or exposed male (red circle, n = 5) (Q 2 = 0.97, R 2 = 99.5%, and A = 4).
