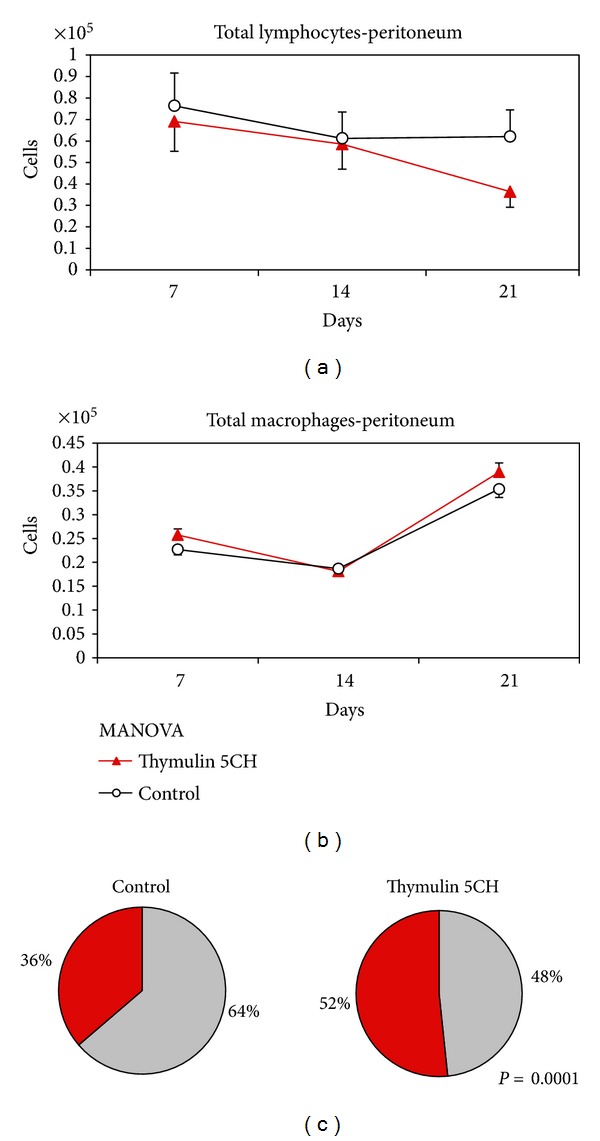
Figure 11.

(a) Total peritoneal lymphocytes; (b) total peritoneal phagocytes, both quantified by flow cytometry in function of time. Data represented by mean and standard deviation, MANOVA; (c) proportion lymphocyte (grey)/phagocyte (red) at day 21st. Data represented by the mean of cells harvested from five mice per group. *P = 0.0001 in relation to control, X 2.
