
Figure 6.
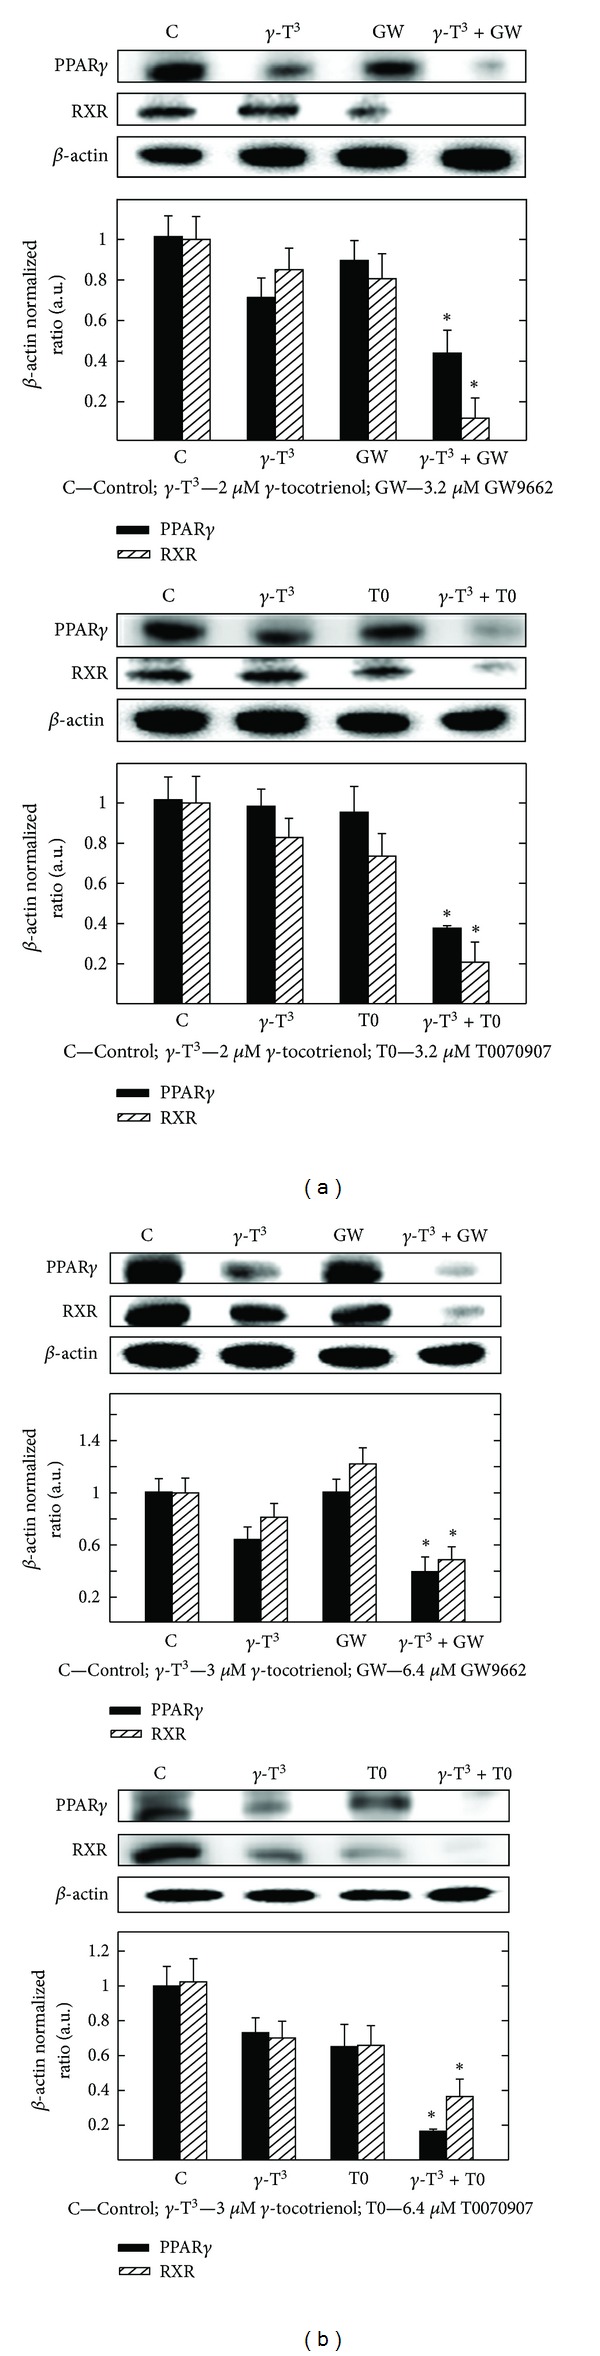
Western blot analysis of γ-tocotrienol and PPARγ antagonists (GW9662 and T0070907) given alone or in combination on the levels of PPARγ and RXR after a 4-day incubation period in (a) MCF-7 and (b) MDA-MB-231 cells. MCF-7 cells were initially plated at 1 × 10⁶ cells/100 mm culture dish and treated with control or treatment media containing either 2 μM γ-tocotrienol, 3.2 μM GW9662, or T0070907 alone or in combination. MDA-MB-231 cells were plated in a similar manner and treated with control or treatment media containing either 3 μM γ-tocotrienol, 6.4 μM GW9662, or 6.4 μM T0070907 alone or in combination. All cells were fed fresh treatment media every other day for 4-day incubation period. Afterwards, whole cell lysates were prepared from each treatment group for subsequent separation by polyacrylamide gel electrophoresis (50 μg/lane) followed by Western blot analysis. Scanning densitometric analysis was performed on all blots done in triplicate and the integrated optical density of each band was normalized with corresponding β-actin, as shown in bar graphs below their respective Western blot images. Vertical bars in the graph indicate the normalized integrated optical density of bands visualized in each lane ± SEM. *P < 0.05 as compared with vehicle-treated controls.