Figure 1.
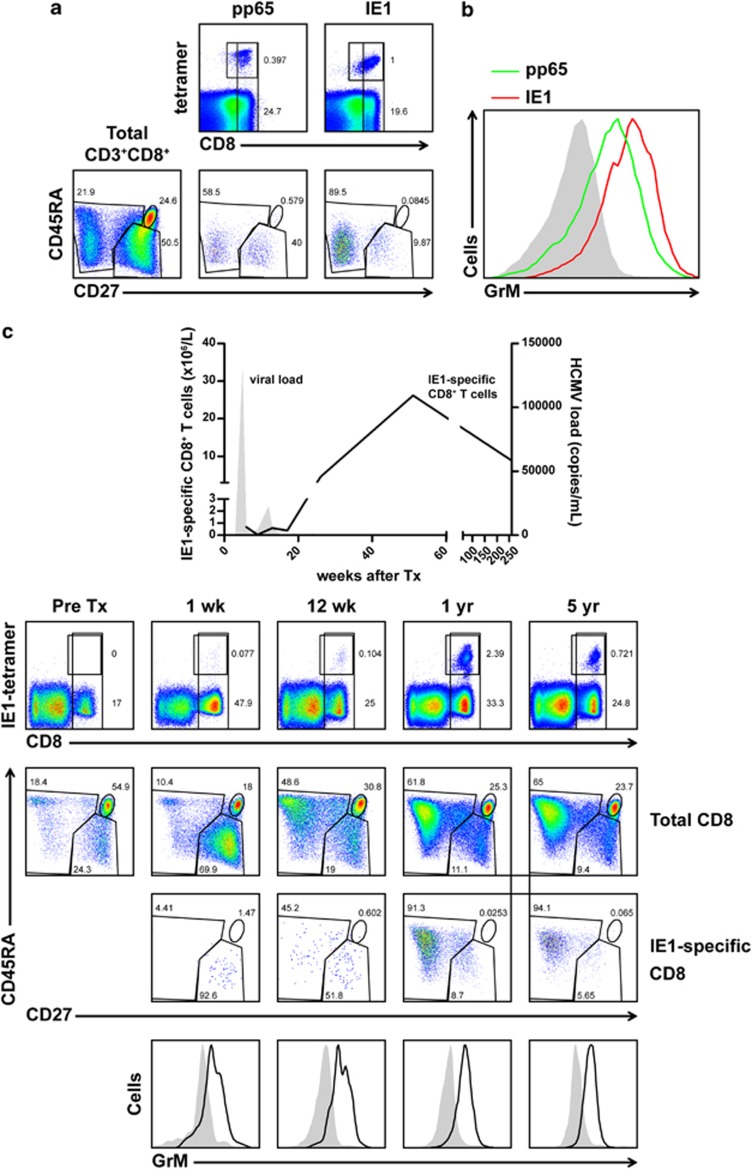
GrM is expressed in HCMV-specific CD8+ T cells. (a) FACS plots show the expression of CD8- and HCMV-specific pp65 and IE1 tetramers on CD3+ T cells (upper row) or the expression of CD27 and CD45RA (bottom row) on total CD3+CD8+ T cells (left) or HCMV-specific CD3+CD8+ T cells (middle, right). (b) FACS histogram visualizes the relative intracellular GrM protein levels in naive CD3+CD8+ T cells (filled gray) and HCMV-specific CD3+CD8+ T cells (lines). (c) PBMCs were isolated from a renal transplant patient pre- and post-transplantation. Graph depicts kinetically the absolute numbers of IE1-specific CD3+CD8+ cells (line) and HCMV viral load (filled gray). FACS plots show the expression of CD8 and IE1 tetramers on CD3+ T cells (upper row), and CD27 and CD45RA on total or IE1-specific CD3+CD8+ T cells (middle rows). Histograms (bottom row) visualize the relative intracellular GrM protein levels in naive CD3+CD8+ T cells (filled gray) and IE1-specific CD3+CD8+ T cells (line)

