Figure 6.
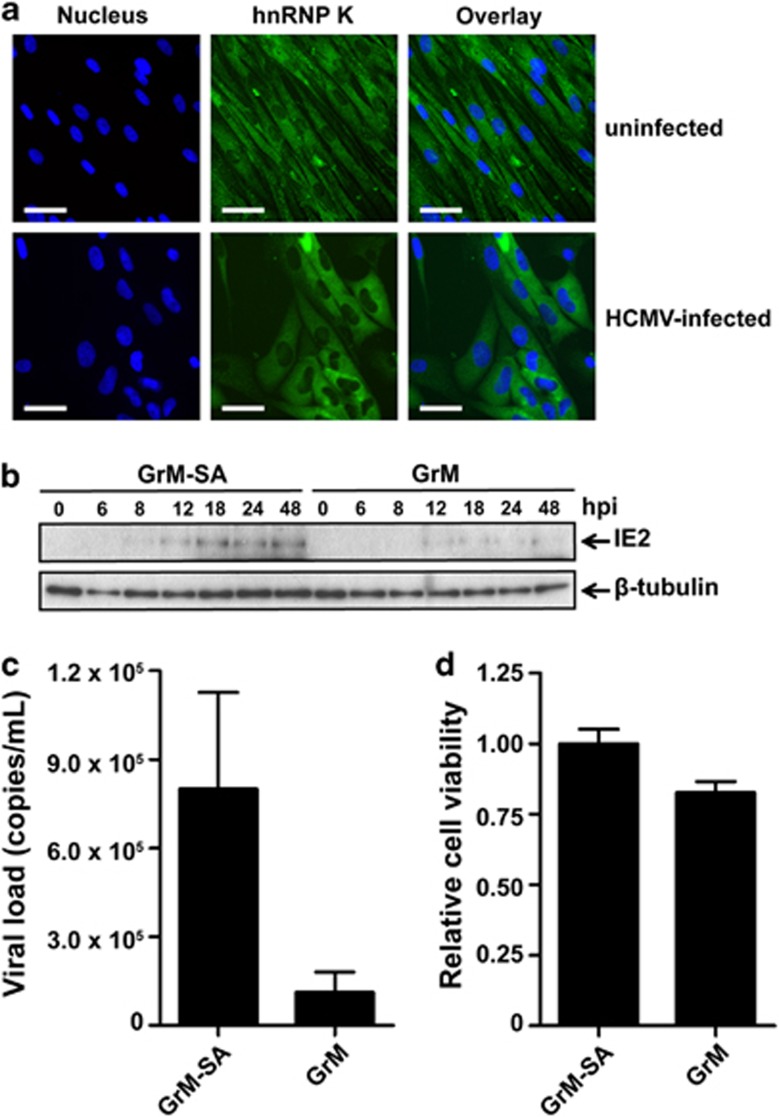
HnRNP K localization and GrM-mediated decrease of IE2 protein expression. (a) Immunofluoresence images of uninfected (upper panel) and HCMV-infected (lower panel) HFFs at 72 h.p.i. Nuclei are stained blue and hnRNP K is visualized in green. Bars, 50 μm. (b) HCMV-infected fibroblasts were treated with GrM-SA (500 nM) or GrM (500 nM) in the presence of SLO (1 μg/ml) at 2 h.p.i. and cells were lysed at indicated time points. Lysates were subjected to immunoblotting using antibodies against IE2 or β-tubulin. Data depicted are representative of at least two independent experiments performed in triplicates. (c) HCMV-infected fibroblasts were incubated with GrM (500 nM) or GrM-SA (500 nM) in the presence of SLO (1 μg/ml) at 2 h.p.i. HCMV viral load in supernatants at 72 h.p.i. was assessed by quantitative PCR. Bars represent the mean±S.D. of triplicates. (d) HCMV-infected fibroblasts were incubated with GrM (500 nM) or GrM-SA (500 nM) in the presence of SLO (1 μg/ml) at 2 h.p.i. Relative cell viability at 24 h.p.i. was assessed by WST-1 assay. Bars represent the mean±S.D. of triplicates

