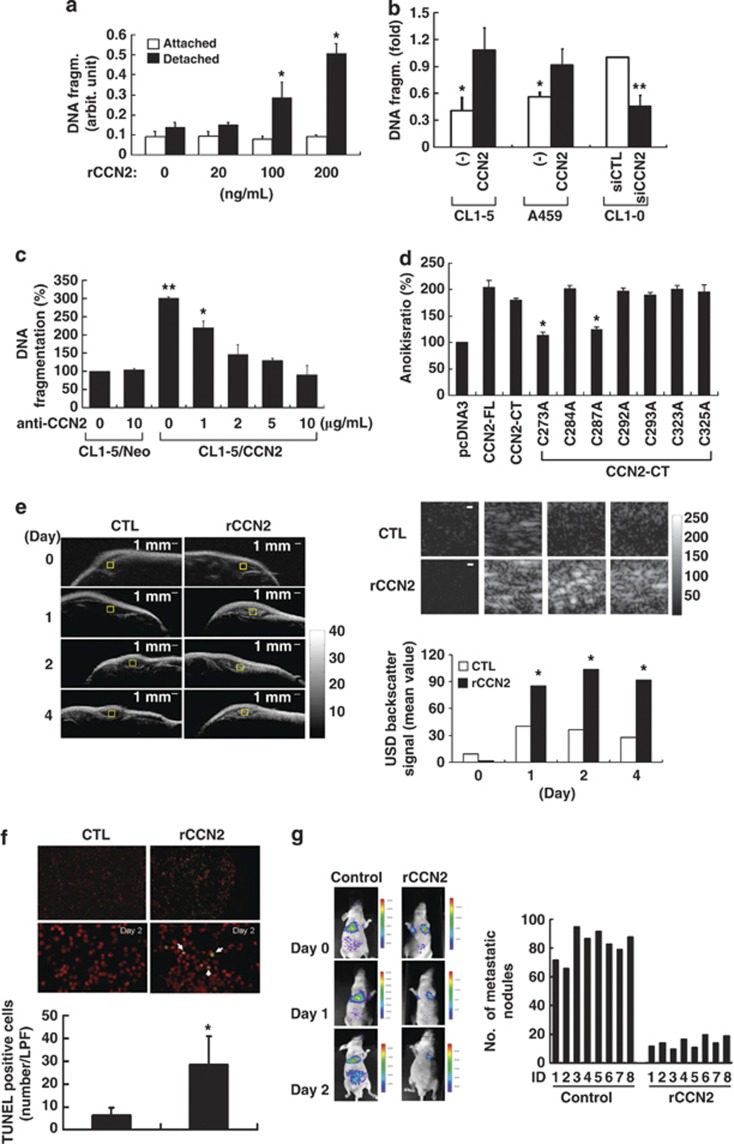
Figure 5.
CCN2 induces anoikis and inhibits metastasis of lung cancer cells. (a) Anoikis of CL1-5 cells growing under attached or suspended conditions received indicated dosages of rCCN2 treatment for at 24 h. Data was means±S.E. (n=6 per group). *P<0.05. (b) CL1-5, A549, and CL1-0 cells were transfected with either CCN2 or siCCN2 and the corresponding control vectors as indicated. Anoikis cell ratio at suspended for 24 h (means±S.D. of five independent experiments). (c) Anoikis in CCN2 transfectants with CCN2-neutralizing antibody treatment. CL1-5/Neo cell apoptosis in 24 h suspension represents the 100% control. Data was means±S.E. (n=4 per group). *P<0.05 and **P<0.01. (d) In CL1-5 cells, CCN2 variants were transiently transfected and suspended for 24 h, and anoikis ratio was analyzed. (e) Representative high-frequency ultrasonic imaging showing DNA apoptotic signaling (left, and top right indicated as the amplification view of the yellow squares) as s.c. tumor-bearing mice. Scale bar: 1 mm. The quantification data (bottom right) was presented from rCCN2 treatment and control group. *P<0.05. (f) Increased anoikis ratio at day 2 in fresh tumor section of i.p. injected rCCN2 in tumor s.c. injected mice, compared with vehicle control mice. The fresh sample as assessed by TUNEL staining (top). Quantified data are means±S.D. (bottom, n=8 mice per group). Low power field (LPF: × 40 original magnification), *P<0.05. (g) Fluorescence imaging of mice in vehicle or rCCN2 treatment (1 mg/kg per day; i.p. injection) after i.v. injecting CL1-5 cells at indicated days (left). Distal metastasis of lung nodules are presented at 2 months (right). Bars represent numbers (n=8 mice per group)

