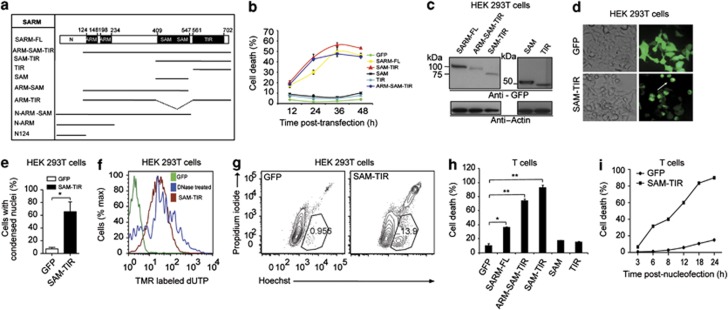
Figure 1.
Induction of cell death by SARM in (b–g) HEK 293T and (h–i) Primary CD8 T cells. (a) A schematic representation of all the truncated constructs of SARM used in this study. HEK cells in 12-well plate were transfected with 800 ng of the indicated GFP fusion construct. (b) Cell death was quantified by dead cell stain, 7-AAD. (c) Cell lysates from 24 h post-transfection were immunoblotted with anti-GFP. The membrane was stripped and reprobed with anti β-actin. (d) White arrow indicates that SAM–TIR-transfected cells at 24 h post-transfection show distinctive morphological rounding up compared with GFP-transfected controls. (e) Nuclear condensation of SAM–TIR-transfected cells was visualized by DAPI staining. SAM–TIR–GFP-positive cells in 20 random microscopic fields were enumerated and the percentage was calculated based on GFP-positive transfected cells. (f) At 24 h post-transfection, the fragmented nuclei were quantified by labeling the nicked ends of the DNA by TUNEL assay. DNase I-treated cells were used as positive control. (g) SAM–TIR-transfected cells at 12 h were double-stained with Hoechst and propidium iodide to study cell membrane integrity and condensation of the nuclei. (h) Activated primary CD8 T cells were nucleofected with 4 μg of indicated truncated SARM constructs. Cell death was quantified 24 h post-nucleofection by 7-AAD staining. (i) Kinetic profile of primary CD8 T-cell death following nucleofection with SAM–TIR compared with GFP alone cells. Panels b, e and h are repeated for three independent times. Data in b, e and h represent means±S.D. of at least two independent experiments. *P<0.005; **P<0.0005

