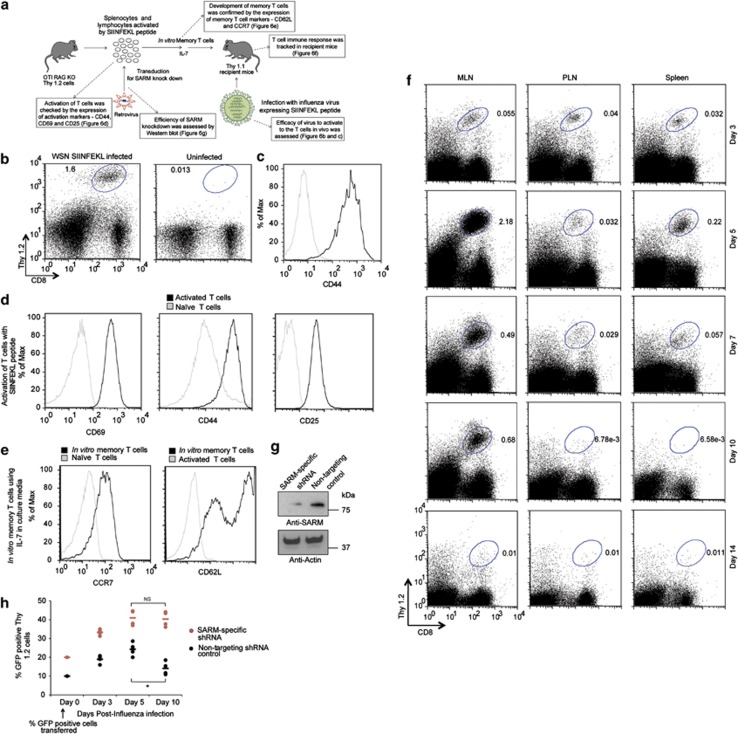
Figure 6.
SARM knockdown T cells proliferated more than control T cells following influenza infection. (a) Schematic representation of the development of an adoptive transfer mouse model to study the effect of SARM knockdown during influenza infection. Boxes indicated by dotted arrows are the results of key assessments performed to ensure efficient response by the adoptive transfer mouse model system. (b) Thy1.2-positive OTI CD8 T cells in the mediastinal lymph node (MLN) of infected and uninfected recipient mice on 7 dpi. (c) CD44 expression in Thy1.2-positive OTI CD8 T cells. Grey line corresponds to naive OTI CD8 T cells from OTI+ RAG−/− mice and solid black line corresponds to OTI CD8 T cells from infected recipient mice. (d) Primary T cells were activated with 1 μg of SIINFEKL peptide and the cells were stained with activation markers (CD69, CD44 and CD25) on days 0 and 2 post activation. Post staining, the cells were washed and resuspended in FACS buffer and analyzed by flow cytometry. Black line corresponds to in vitro activated primary T cells and grey line corresponds to naive primary T cells. (e) Activated OTI CD8 T cells were cultured in the presence of IL-7 for more than 2 weeks to develop into memory T cells, and verified by staining with CCR7 and CD62L. Grey line corresponds to naive and activated T cells in CCR7 and CD62L staining, respectively. Solid black line corresponds to in vitro developed memory T cells. (f) OTI CD8 T cells in mediastinal lymph node (MLN), peripheral lymph node (PLN) and spleen of infected recipient mice at various dpi. The Thy1.2 versus CD8 profile was gated based on all live cells in the indicated tissues. (g) Lysates from retroviral-transduced in vitro memory T cells (non-targeting control and SARM-specific shRNA) were immunoblotted with anti-SARM. The same membrane was reprobed with anti-actin. (h) The proportion of GFP-positive non-targeting shRNA or SARM-specific shRNA expressing OTI CD8 T cells in MLN of infected recipient mice on various dpi. Data represent the means of results from four recipient mice. *P<0.0007; NS; non-significant

