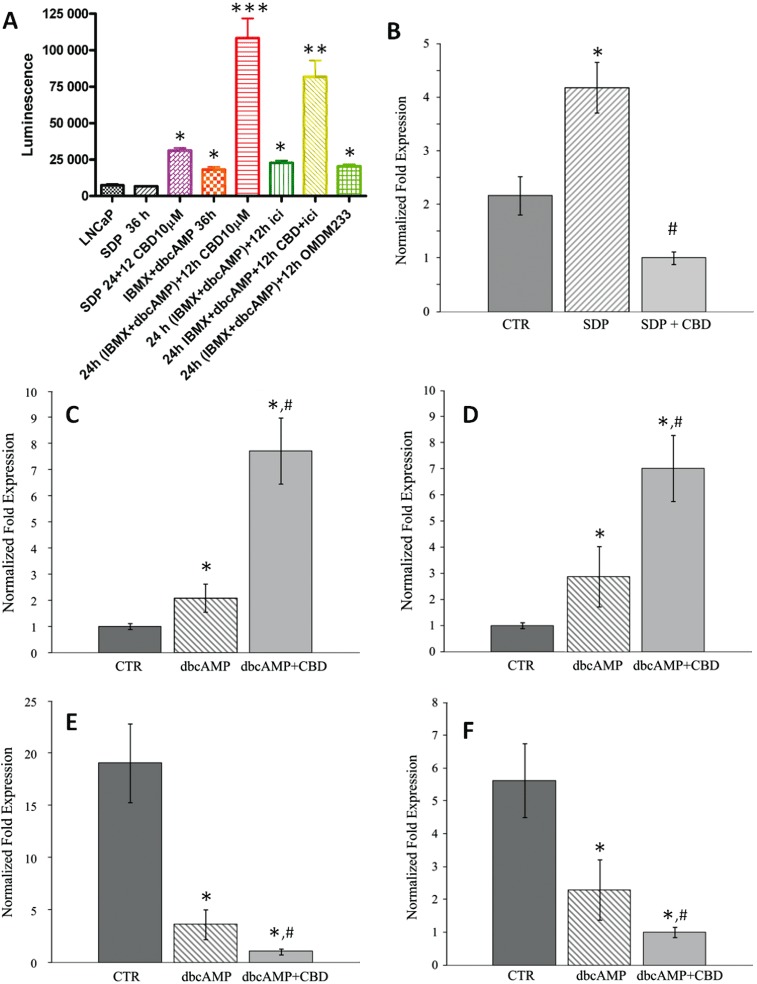
Figure 6.

Effects of CBD on neuroendocrine-like LNCaP cells. Cells were differentiated with db-cAMP + IBMX for 36 h in serum-deprived medium, in the presence or absence of CBD and various other compounds. (A) Effect on caspase 3/7 activity of just serum deprivation for 36 h, alone or with CBD (10 µM) for 12 h, or with db-cAMP + IBMX for 36 h, or with db-cAMP + IBMX for 24 h followed by 12 h CBD, or with db-cAMP + IBMX followed by 12 h icilin (1 µM) or OMDM233 (2 µM), or with db-cAMP + IBMX followed by 12 h CBD + icilin. *, **, ***P < 0.05, 0.01, 0.001 versus SDP 36. (B) NSE mRNA in differentiated LNCaP cells. Cells were cultured in the presence of serum (CTR), in serum-deprived medium for 36 h in the presence of db-cAMP and IBMX (SDP) and in the presence of 10 µM CBD for 12 h during db-cAMP + IBMX treatment (SDP + CBD). qRT-PCR was performed using 20 ng of cDNA per assay. The expression levels of NSE mRNA, normalized respect to the reference gene, were scaled to the lowest expression value condition, considered as 1; i.e., SDP + CBD (28.67 cq vs. background >40 cq). PUMA (C), p27kip (D), AR (E) and TRPM8 (F) mRNA levels in LNCaP cells following various treatments in serum-deprived (SDP) cells. Cell were cultured in presence of serum (CTR), in serum-deprived medium for 36 h in presence of db-cAMP + IBMX (dbcAMP) and in presence of 10 µM CBD for 12 h during db-cAMP + IBMX treatment (dbcAMP + CBD). For all the targets, the expression levels normalized respect to the reference gene were scaled to the lowest expression value condition, considered as 1; i.e. CTR (28.68 cq vs. background at 37.53) for PUMA and p27kip (24.75 cq vs. background at 38.40cq); and db-cAMP + CBD for AR (29.04 vs. background >40 cq) and TRPM8 (29.50 vs. background at 35.80 cq). In panels B–F, qRT-PCR was performed using 20 ng of cDNA per assay, and a typical experiment (R.I.N. > 8.5) is shown. Standard deviations were calculated by the gene expression module of iQ5 real-time PCR. All differences indicated in the graph (*) were significant (P < 0.05) versus CTR as evaluated according to Pfaffl, 2010 (see Supporting information). # denotes P < 0.05 versus CTR.
