
Figure 5.
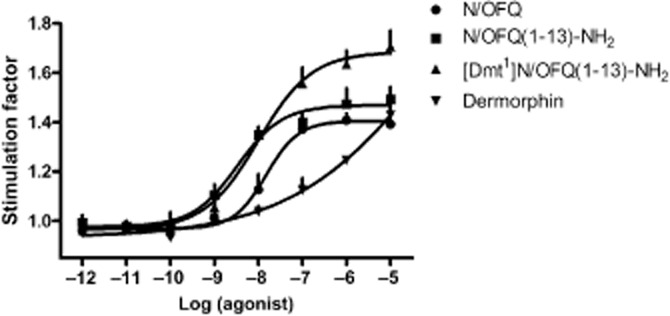
[35S]-GTPγS binding experiments. Concentration–response curves to N/OFQ, N/OFQ(1–13)-NH2, dermorphin, and [Dmt1]N/OFQ(1–13)-NH2 in membranes of the rat cerebral cortex. Data are the mean ± SEM of four separate experiments performed in duplicate.