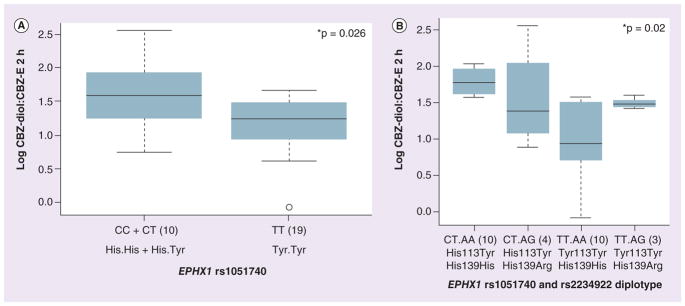
Figure 2. Association of EPHX1 SNPs (rs1051740; Tyr113His) and diplotypes (rs1051740-Tyr113His and rs2234922-His139Arg) with the carbamazepine-10,11-trans dihydrodiol:carbamazepine 10-11 epoxide ratio measured at 2 h in an African–American cohort.

(A) Box plot for the association of the EPHX1 Tyr113His SNP (rs1051740) with the CBZ-diol:CBZ-E ratio measured at 2 h in an African–American cohort. (B) Box plot for the association of the EPHX1 for the Tyr113His (rs1051740) and His139Arg (rs2234922) diplotypes with the CBZ-diol:CBZ-E ratio measured at 2 h in African–American cohort. Box plots indicate 2nd and 3rd quartiles, with the bold line within the box representing the median value; the whiskers represent the range after excluding the outliers. The outliers are defined by the R package as data points that fall outside of the 2nd and 3rd quartiles by more than 1.5-times the interquartile range, and circles falling outside the whiskers represent outliers. The p-values from the Kruskal–Wallis nonparametric test comparing the significance of three genotypes, and the Wilcox test comparing two groups are shown.
*p < 0.05.
CBZ: Carbamazepine; CBZ-diol: Carbamazepine-10,11-trans dihydrodiol; CBZ-E: Carbamazepine 10-11 epoxide.
