
Figure 1. Biomineralization phenotypes of the R3 gene mutants in AMB-1.
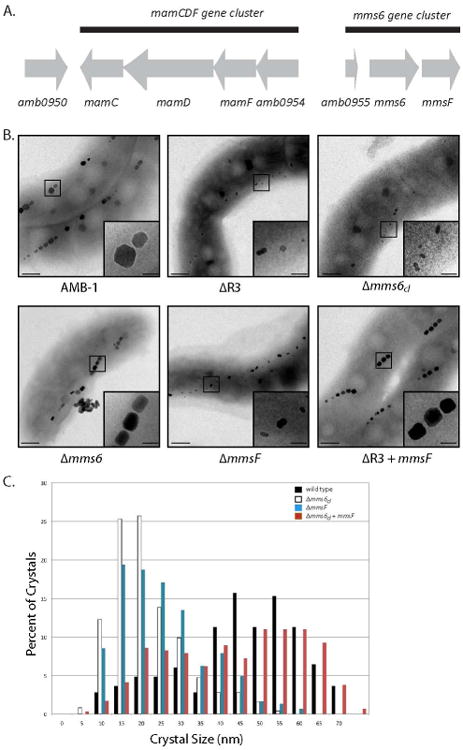
A. The genes and ORFs comprised in the region R3 are represented by grey arrows, and indicate the orientation of transcription. The gene name, or gene number, is indicated below each gene or ORF. The black lines show the groups of genes identified as gene clusters. B. Electron micrographs of (from top to bottom, left to right) wild type AMB-1, ΔR3, Δmms6cl, Δmms6, ΔmmsF mutants and the ΔR3 mutant complemented with mmsF. The insets are showing a higher magnification of the region boxed in the micrograph. Scale bars: 100 nm, insets 50 nm. C. The ΔmmsF mutant mimics the ΔR3 biomineralization phenotype. Crystal size distribution in wild type AMB-1 (black bars), Δmms6cl, (white bars), ΔmmsF (blue bars) and Δmms6cl + mmsF (red bars).