Figure 3.
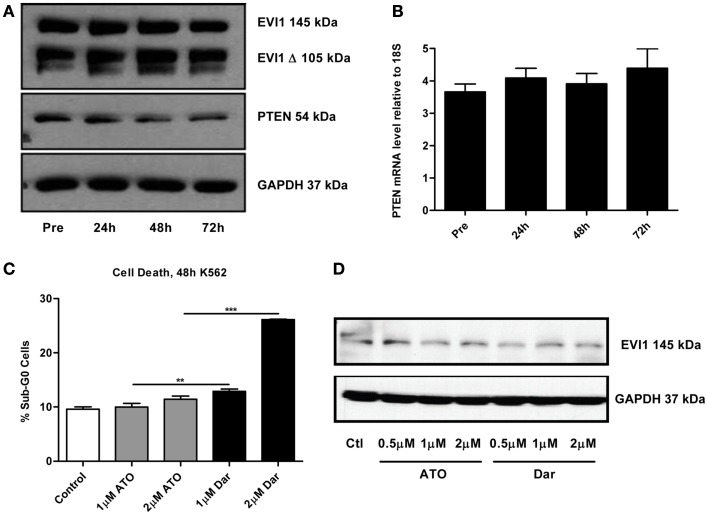
(A) Western blot of full-length ecotropic viral integration site 1 (EVI1), a truncated form of EVI1 (EVI1 Δ) and PTEN expression in peripheral blood mononuclear cells at the time points indicated. No fusion of EVI1 and MDS1 was detected in these cells. GAPDH is included as a loading control. (B) Levels of PTEN mRNA measured by qPCR. Expression levels are shown as PTEN ΔΔct/GAPDH ΔΔct. Error bars indicate SEM. No statistically significant differences in mRNA levels were found. (C) K562 chronic myeloid leukemia cells were treated for 48 h with the indicated doses of arsenic trioxide (ATO) and darinaparsin (Dar) to assess sensitivity to arsenicals. Cell death was measured as the percentage of cells with sub-G0 DNA content. Error bars indicate SEM. (D) Western blot of EVI1 in K562 cells treated for 24 h with the indicated doses of ATO and darinaparsin (Dar). GAPDH is included as a loading control.

