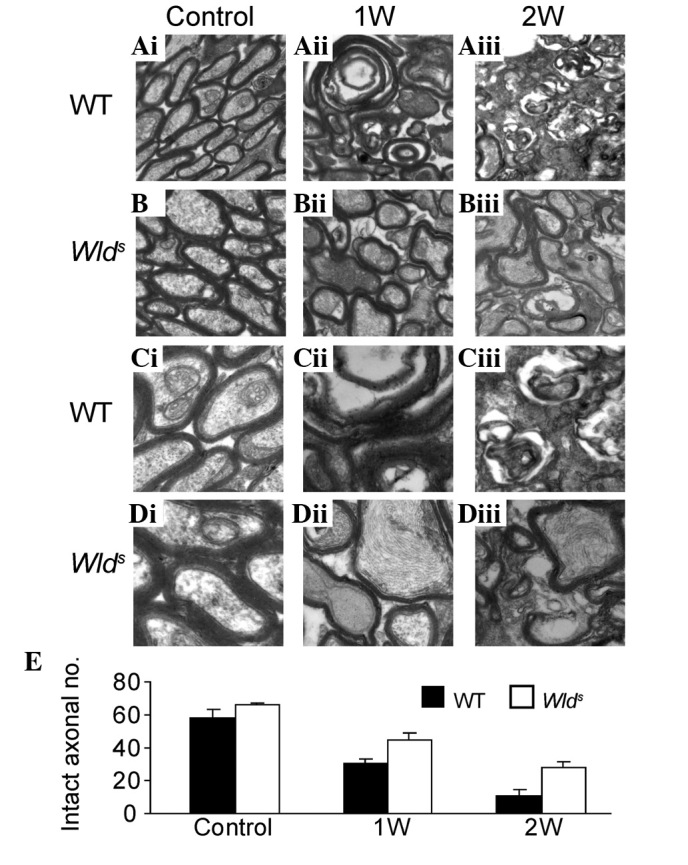
Figure 4.

Electron micrographs from (A and C) WT and (B and D) Wlds mice before or 1 and 2 weeks after surgery. Magnifications: upper panel (A and B) 1:20,000, lower panel (C and D) 1:50,000. (E) Quantitative results of the number of intact axons before and after ON surgery in WT and Wlds mice. WT, wild-type; Wlds, Wallerian degeneration slow; ON, optic nerve.
